3 Strategic Tips to Unleash the Power of Self-Service BI Tools
Traditional reporting tools are primarily a product of the past. Sure, some of these tools have a nice application for operational reporting needs. But we’re seeing more frequently that many of these operational reporting features are being built into ERP (Enterprise Resource Planning) systems directly.
With the growth in computing power, ERP systems can often handle the operational reporting load and therefore do not require separate reporting systems for operational needs. This may not be the case with larger organizations.
Take Workday for example. This product has fantastic reporting capabilities built into the ERP directly. Both the reports and the product are SaaS-based and available from a standard web browser. Workday offers drillable displays that are contextual and actionable. Additionally, the product provides real-time operational intelligence by cross-walking data sets that reside within the Workday platform. This is a good example of some of the sophistication – and general ‘goodness’ – that is happening in the ERP world.

You’re probably starting to contemplate, what self-service BI tool should I use then? The answer is…it depends.
The most common formula is a mix of tools. There is likely still a need for your operational reporting tool. As your users become more sophisticated, or perhaps as your IT department matures, you may consider a self-service BI tool such as Tableau or a newcomer in the space like Pyramid Analytics. Doug Henschen from InformationWeek wrote a nice article here which discusses the Gartner Magic Quadrant for BI and compares 2014 to 2013.
If you’d like a more active comparison of products, TrustRadius has done an amazing job in collecting from real users reviews which are incredibly helpful. You can compare and read the reviews in more detail to understand strengths and weaknesses. Also, remember that you’ll likely have a group of statisticians that want a tool such as SAS, IBM SPSS, or Stata in place also. The next challenge is how best to support all of these tools, manage the associated data, security, access, and keep your sanity.

Tip #1: Create a BI strategy
- What tools work best for your organization and for what audiences? Consider operational reporting tools, self-service BI tools, and statistics tools.
- When does a user use one tool versus another?
- What data are available to consume in these tools?
- Do you have a data warehouse and have you built cubes from this warehouse?
- What is the lineage of each data element in the data warehouse or cube?
- How do you govern these data among the various stakeholders?
Tip #2: Utilize a portal
- Create a central location for users to access various BI tools.
- Make it easy to remember (e.g. analytics.yourcompany.com).
- Use this space to collaborate and provide helpful training, data dictionaries, report/dashboard glossaries, and overall BI tricks and tips.
- Don’t forget the user experience. Make this portal easy-to-use. At the end of the day, if it is not easy to use, users will not use it.
Tip #3: Govern and structure data AND provide flexibility of use
- Ensure that you have a data governance strategy, a dedicated team, or cross-functional working group.
- Rigorously maintain definitions, eliminate duplication and redundancy, and be a stickler about data quality.
- As structured as the first two bullets sound, don’t let this overshadow the importance of flexibility of use:
- Don’t over-engineer security (e.g. BI security should be different and less granular than ERP security)
- Provide training and ensure that tools are available and understood by the user base
- Try to make associated processes as electronic as possible. Use applications which have workflow capabilities to drive process and document it. Make it easy to gain access within the appropriate approvals.
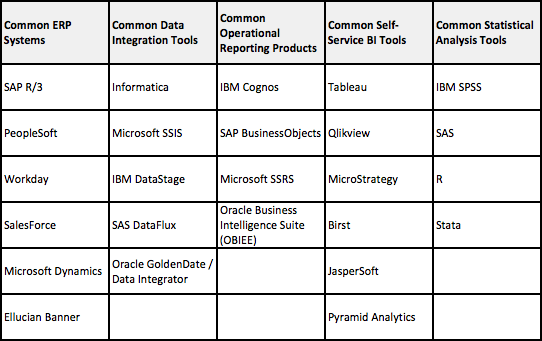
I hope these items have spurred thoughts for your own business intelligence suite. In no particular order, I have listed a very abbreviated list of tools in each category below:

And, don’t forget your portal tool – many organizations use tools such as Microsoft’s SharePoint product. SharePoint offers great integration if you are using the Microsoft stack. It has the capability of driving new Microsoft BI features such as the in-memory PowerPivot or the new flashy PowerView. It is also integrated with Office365 and can serve as the platform for Project Server.
These are all big benefits if you play in the Microsoft space. If not, SharePoint is still a sophisticated tool to consolidate different reporting tools into one location and provides a nice platform for collaboration.
Overall, these are simple suggestions will empower your organization to fully leverage self-service BI tools in an organized fashion.
Do you have any tips to add to this list? We’d love to hear from you with a view of sharing this information with the broader BI community!
Was this helpful?