Discrete vs. Continuous Variables & Data: Understanding Their Differences
For many professionals, modern data analytics may make them wish they’d paid more attention in math class. Concepts like “discrete variables” and “continuous variables” now form the foundation for the business world’s information environments. Understanding the difference between the two (and why the differences matter) can make or break your analyses and decision-making.
Looking for data analysis tools? See our recommendations below:
- Best Data Preparation Software
- Best Digital Analytics Tools
- Best Data Visualization Platforms
- Best Data Catalog Software
What is Discrete Data?
Discrete data is countable, distinct, and separate values. They are not divisible and only exist in set increments or units.
Discrete variables have a limited number of possible values between two intervals. In other words, there is a finite number of “points” between two other points. A key characteristic of discrete data is that it is “countable,” versus being “measurable.”
It’s important to remember that discrete data does NOT have to be numbers. It can encompass a wide range of scores and information. For instance, it covers ordinal data like sliding scales (e.g. “bad, neutral, good”). Another example is letter grading systems, which cannot give half of an “A” grade.
One notable downside of discrete data is its limited granularity. Users can only subdivide discrete variables into their smallest units, without the possibility to get more granular or precise. This can sometimes limit the available specificity in discrete data values.Discrete data has limited granularity. Users can only subdivide discrete data to its smallest unit. This can inhibit some level of specificity in discrete data values. It also allows users to work with discrete integers more quickly and easily.
What are Discrete Variables? (Examples)
Discrete data often describes physical or material entities. For instance, the number of students in a classroom. A store’s inventory of computers is another discrete variable because there is a set amount of computers within the inventory. It wouldn’t make sense to have “17.5 devices.”
Because discrete values are integers, the most common types are “number of” (or counts of) something:
- Number of employees working for a company
- Number of questions on a test
- Number of cars in a parking lot
- Number of pages in a book
- Number of rooms in a house
- Number of goals scored
- Number of tickets sold
What is Continuous Data?
Continuous data is measurable information, rather than being countable. Continuous variables use increments that are infinitely divisible and subcountable.
Using the previous example from discrete data of having finite intervals between two values, continuous data has infinite possible intervals between values. To visualize this, imagine how many numbers are between 5 and 10. If the data is continuous, there are infinite decimals with increasing precision between these numbers (7, 8.3, 6.825, 9.99999).
Because of this, continuous data allows for much more granularity and specificity (depending on the tool used to measure or record the data). Physical measurements of continuous data, such as weight, can only be as detailed as the measurement tool allows. But other examples, like digital analytics tools, often specify values to hundredths of a percent.
What Are Continuous Variables? (Examples)
Continuous variables encompass most data that can be measured via an external scale. An item’s weight, a person’s height, and even time are common examples. In a business context, continuous data includes product dimensions, average order value, and time spent on a project. Abstract measurements are also continuous, such as productivity or efficiency measurements.
Common examples of continuous measurements you may see in everyday life include:
- Height or length of an object
- Age of a person
- Weight of an item
- Temperature outside
- Duration of a task
- Speed of a vehicle
- Blood pressure
- Heart rate
- GPA
- Sound intensity
- Brightness of a light
How to Determine if Data is Discrete or Continuous
Continuous data allows for more (technically infinite) granularity. In contrast, discrete data is limited to a preset level of specificity. In cases where users need quick, easy, high-level access to data, discrete variables may be preferred.
The best way to identify whether your data is discrete or continuous is to consider whether it can be calculated to greater and greater precision depending on the tool or method. Some scales may only calculate weight (continuous) to the nearest tenth of a pound, while more advanced methods can measure weight to the thousandth or even millionth of a pound. Measuring the number of people in a room (discrete) can never get more precise than the counted integer.
The other way to think about these data types is to consider whether there are infinite values within a given range. Using the same examples as above, we know that there can be infinite values between 3 lbs and 4 lbs (3.1 lbs, 3.2 lbs, 3.25 lbs, 3.257 lbs, and so on). Applying a range to the number of people in a room, there can only be a finite number of values between 8 people and 10 people — this variable is therefore discrete.
Discrete vs. Continuous Data Characteristics
| Discrete Data | Continuous Data |
| Countable | Not countable (infinite) |
| Cannot be divided beyond its base unit | Subdivisible |
| Less granularity | More granularity |
| Includes integer and ordinal values | Includes quantitative data (fractions, percentages, decimals) |
The Importance of Continuous and Discrete Data
Typically, continuous data is the default structure and type for business use because of its precision and basis in measurement. However, both types of data play key roles. Counts of inventory or number of people on a project can’t be continuous and should be tracked as their discrete values. If businesses use discrete data to create continuous values, they still maintain the original discrete values.
Using the different types properly and for the right decisions is critical for effective analysis. For example, understanding what data assets are continuous and can be used in forecasting can make or break the reliability of that estimation. Tracking various discrete variables like the number of projects completed, leads generated, or defective items not only helps to monitor performance over time, but also serves as the foundation of continuous calculations like averages, speeds, and more.
Graphical Representations & Visualizations
Because of the nature of their differences, discrete and continuous data are often represented with different methods and visualizations as well. Some examples of discrete vs. continuous graphs and charts include:
| Discrete Data | Continuous Data |
| Bar charts | Line charts |
| Pie charts | Density plots |
| Frequency tables | Area charts |
More Discrete vs. Continuous Examples
While we’ve covered individual examples of discrete and continuous variables, it’s important to remember that many “categories” of measurements will have both continuous and discrete metrics. Some examples of this include:
| Data Category | Discrete Variable Example | Continuous Variable Example |
| Product Sales | # of units sold | Revenue from sales |
| Website Engagement | # of site visits | Average time per session |
| Rainfall (in a Given Period) | # of rainy days | Total rainfall amount |
| School Course Impact | # of students enrolled | Average test scores |
| Investment Portfolio | # of shares owned | Total value of portfolio |
How Businesses Use Continuous and Discrete Data
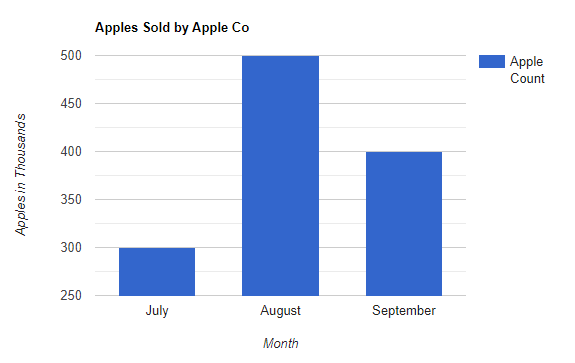
Let’s discuss the difference in utility between the two data types using an imaginary apple company. Using discrete information, we can assess:
- Apples sold in the month of August
- Units of fuel used in transport
- Dollars of profit and expenses in August
- Number of trucks that broke down
These are essential data points for keeping a company flowing, are easily visualized in formats like bar charts, and are great for quick information. These data points are discrete because (as a reputable company) we didn’t sell half apples.
However, the aggressive pace of efficiency and optimization makes the specificity of continuous variables a must for businesses. In our apple company, continuous data will show things like average sales per day, the weight of each shipment, and the rate of truck breakdowns. All of this precise and divisible data enables us to examine attributes such as spoilage rates and trend lines.
Apple Company Example
To demonstrate why this is so useful, here is an example of similar information, portrayed using continuous data versus discrete. If you are in charge of product quality and reported 10,000 spoiled apples in July and 12,000 in August, you have presented a rise in spoilage.
However, with continuous data, you could report that apple spoilage rate is actually down from 3.3% to 2.4%. This is obviously a vast oversimplification but shows the relative utility of both in a professional setting.
Turning Discrete into Continuous
Modern business processes will often convert discrete data to continuous data during analysis. Methods like regression analysis are common examples of this phenomenon. Take Net Promoter Scores (NPS) for example. This data point measures how likely users are to recommend a product on a discrete scale of whole numbers from 1-10.
A pool of discrete ratings on its own isn’t very helpful. Instead, a data analyst averages all NPS ratings to get an average NPS score. Depending on the averaged discrete values, the average NPS score could be specified as a continuous value, such as 7.483.
This granularity is crucial to tracking changes in the NPS score over time. Continuous NPS data can capture even small trends in the score over time. The business can also keep the original discrete values for data integrity.
Today, most businesses use a range of statistical analysis software to surface business insights, incorporating both continuous and discrete data inputs. Some of the most common types of analytics software include:
- Mobile Analytics Tools
- Web Analytics Tools
- Predictive Analytics Software
- Business Intelligence (BI) Tools
For those who have used platforms in any of the software categories we have discussed, please leave a review to help other buyers make informed decisions!
Discrete vs. Continuous FAQs
How can you tell if a graph is discrete or continuous?
Discrete graphs often have distinct parts (bars, points, etc.), while continuous graphs are typically represented with unbroken lines or areas (time series charts or area charts). However, line charts can be based on discrete data such as a line graph of sales over time. This is why it’s best to look at the dependent variable (usually along the vertical axis) to determine whether that data can only be integers or could be further broken down into decimals, fractions, etc.
Is age discrete or continuous?
Age is a continuous variable because it can always be broken down further into more precise measurements (months, days, seconds, etc.). Any measurement of time, whether age, duration, or another derived metric (like miles per hour) is a continuous variable rather than discrete.
Is weight continuous or discrete?
Weight is also continuous because it can be measured at 150 lbs, 150.1 lbs, 150.13 lbs, and so on. However, if a dataset of weight is categorized into buckets (such as “Less than 50 lbs,” “Between 51 and 100 lbs,” etc.), that would be classified as discrete data because there are a finite number of assigned values.
Is money discrete or continuous?
This depends on the type of money — physical money like bills and coins are discrete because they can’t be used to pay amounts more specific than cents. In other words, you can’t use physical money to pay $12.3456. However, digital currency like credit cards and bank transfers may be classified as continuous because they could theoretically be subdivided more than physical money.
Find the Best Data Analysis & Visualization Tools for Your Needs
Understanding your data is critical to maximizing its values and the insights gleaned from it. To get the most out of your data, you need to have the right tools. Whether you’re looking for the best data preparation software, digital analytics tools, data visualization platforms, or data catalog software, TrustRadius has reviews from verified users to help you inform your decisions. None of our rankings can be paid for, so you always know you’re getting accurate and unbiased comparisons with feedback from real people. Learn more about our promise to buyers here.