Evolution of Business Intelligence: Past, Present, and Future
Enterprises are drowning in data. The sheer volume of data about customers, suppliers, products, and business partners has never been so extensive and yet so crucially important. Data mining is more effective at gathering information at scale, and data warehouses are better at storage. Modern BI tools matter precisely because they promise to make sense of the tsunami of data and uncover the insights within that are vital to winning in the marketplace.
The development of BI technology has largely been focused on fulfilling that elusive goal. This article explains the major shifts in approaches to business intelligence and outlines the advantages of the most recent evolution of this technology based on automation through machine learning and AI. As BI vendors move towards this new approach, buyers need to understand this shift as they evaluate products.
For more visual learners, check out this video on the history of BI.
The First Generation of BI: IT as Central Guardian
The first generation of business intelligence software was largely managed by the IT department as the central guardian of all enterprise data. The Extract, Transform, Load (ETL) paradigm combined data from multiple systems to a single database, data store, or warehouse for legacy storage or analytics. Once stored, data was normalized—removing redundancy and duplication—to make it easier to run queries and retrieve data for reporting. IT staff would run queries on behalf of business users who did not necessarily have expertise in query languages.
Ultimately, the IT organization would deliver a static report to the business owner. The entire process could take days or even weeks due to dependence on skilled IT staff. Also, answers provided often provoked additional questions that had to go through the same inefficient process.
Emergence of Data Discovery and Visualization
Given these drawbacks, this approach was eclipsed by a more agile approach that favored self-service capabilities. A new set of BI products emerged that eliminated the technical stack designed for IT users and focused on providing data discovery and visualization tools to business users.
Business users were empowered to use BI tools to access their data, even without advanced technical skills. The focus of these tools is to provide business analysts the ability to conduct an ad-hoc analysis of multiple data sources.
These tools provide data analysts with an intuitive way to sift through large volumes of disparate data to expose hidden patterns and outliers. They replace the rows and columns of traditional data presentations with graphical pictures and charts.
The emergence of data discovery and visualization tools, and the emancipation of business analysts from old-school Extract, Transform, Load (ETL) processes and data modeling, was highly successful. This revolution democratized data and greatly accelerated the speed of data analysis to help companies make data-driven decisions in competitive environments.
Data visualization allows for modern BI to be as much an art as a science. The key performance indicators become more accessible to employees, their bosses, and their companies as a whole. As a result, IT-centric BI vendors quickly started to build these data discovery and visualization capabilities into their product portfolios.
Conversely, data discovery and visualization vendors were quickly pushed by customers to provide enterprise licensing and features, like data governance, security, data preparation, and report generation.
The Next Evolution: Augmented Analytics
As data sets become increasingly large, capabilities like data preparation require users with some technical skills to make sense of potentially huge datasets generated by, for example, IoT devices. After all, data preparation and integration were typically handled by IT specialists as part of the ETL process.
In today’s organizations, data scientists have the primary responsibility of focusing their advanced skills to turn massive quantities of raw data into insight that can have a direct impact on the business.
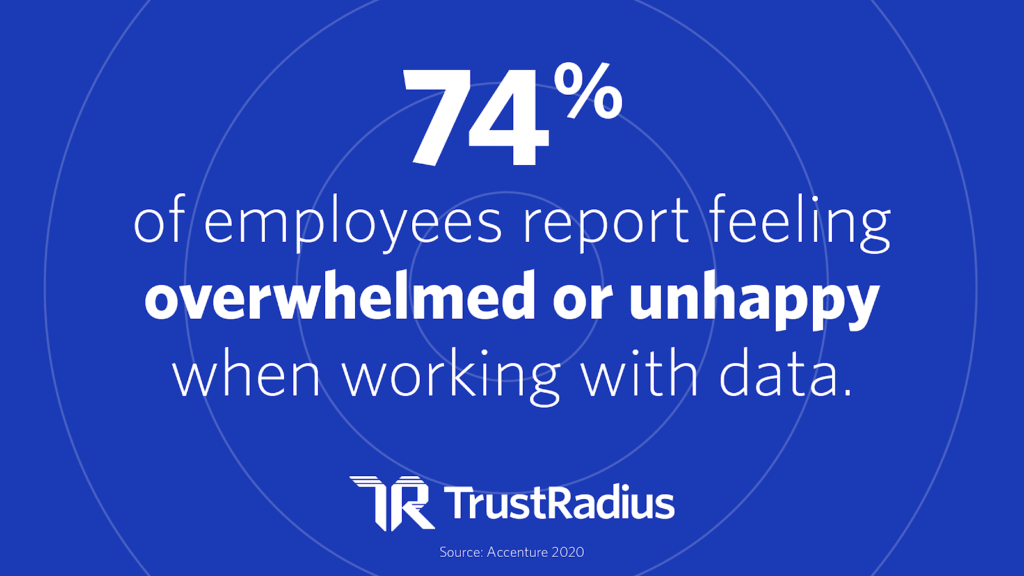
Many employees do not have the skill to perform the data tasks necessary. The vast majority feel overwhelmed with data work.

As a result, companies turn to data specialists. The problem is that there is a chronic shortage of people with the requisite analytics skills to do this. Data scientists are relatively thin on the ground.
The result is the emergence of a third approach to business analytics. Essentially, it’s an evolution of the self-service approach towards automation usually referred to as Augmented Analytics.
Insight generation is the primary reason that organizations invest in BI. But if the people with the right skills to use these tools to get from raw data to actionable insight are scarce, a different approach is needed.
Augmented analytics promises to reduce dependence on highly skilled data scientists by automating insight generation through the use of machine learning and artificial intelligence algorithms.
Today, many well-known BI platforms have built-in capabilities to automate data preparation and detect some correlations and anomalies in large data sets. Some platforms are capable of analysis and even insight generation and action plan generation, but there is still a considerable amount of hype to muddy the waters.
The Three Ages of BI
BI tools have evolved from pixel-perfect reporting engines to analytics platforms powered by powerful artificial intelligence technology.
Traditional BI
- Owned and managed by IT
- No business user autonomy over-performing data analysis > Limited self-service capabilities
- Focus on reporting and KPIs
Self-service BI
- Business user-driven
- Some data analysis autonomy for business users
- Focus on ease-of-use for benefit of broad non-technical user base > User-driven insights to aid business decision-making
Augmented Analytics
- Business users don’t require IT assistance to define data models
- Data preparation and analysis aided by artificial intelligence
- Ease-of-use greatly increased by AI automation
- Data correlation and insights automatically generated to drive decision-making
The Future of BI
This information comes from our report on the state and future of the Business Intelligence market.

The BI market is booming in 2021, and that’s creating rapid innovation. The biggest BI trends today relate to mobile BI, huge increases in the amount of data, and data automation.
Mobile BI
The pandemic accelerated the trend to mobile and remote work environments. new technologies, including more powerful mobile devices, are making BI on-the-go feasible in more fields. Retail and eCommerce will lead this charge in 2021.
Data Growth
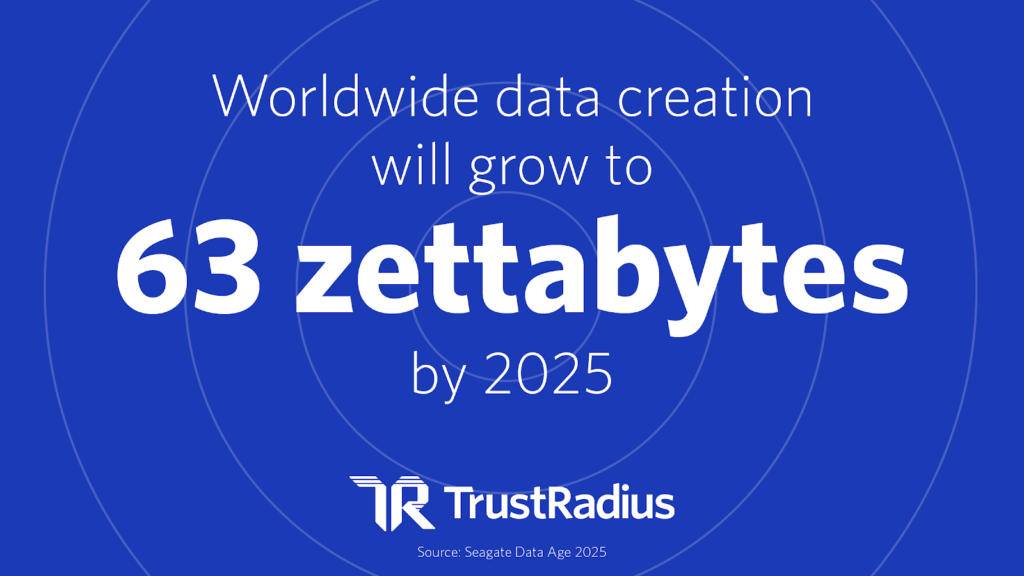
As data volumes explode across the world, we’re seeing major changes in the BI market. Companies already find the sheer volume of data difficult to manage. With exponential data increases every year, we expect BI vendors to respond by rapidly addressing customer challenges and capitalizing on the new opportunity.
Data Automation
Data automation continues to be the most exciting and influential change in the BI market over the past decade. BI vendors use a variety of automation tools to clean up, transform, and transpose information. This functionality is fast expanding into other areas and allowing non-specialists to more effectively make use of information. This trend has the potential to help address emerging problems and improve BI efficiency.
Buyer Next Steps
While the traditional BI focus on reports and dashboards is not going away any time soon, companies should start looking at vendor capabilities in the area of augmented analytics. Most BI vendors are building augmented analytics into their platforms, but it is easy to get swept up in the hype. For more information on the market as a whole, check out our report on Business Intelligence Statistics. For those looking at products, click below to check out our category page.
Was this helpful?

Click here for an in-depth dive into Business Intelligence Statistics
