Cloud BI, Visualization, and Predictive Analytics Likely to Be Fastest Growing BI Tools in 2015
We’ve recently asked BI users about their Business Intelligence software usage and spend in our 2015 Business Intelligence Survey.
The results indicate that BI continues to be a strategic area of focus and investment for companies of all sizes. While intent to invest is highest amongst small and mid-size companies, large companies will invest more in areas like Cloud BI, Data Discovery and Visualization, and Big Data. Most companies will continue to use multiple tools in tandem with each other rather than look to a one-size-fits-all solution; if anything the number of distinct BI tools used is likely to increase.
In our Buyer’s Guide to Business Intelligence Software, we talk more about this renewed interested in the BI software space, particularly in the areas of cloud, big data, and data visualization.
Here are the key findings from our 2015 Business Intelligence Survey:
1. Many companies are using multiple Business Intelligence solutions
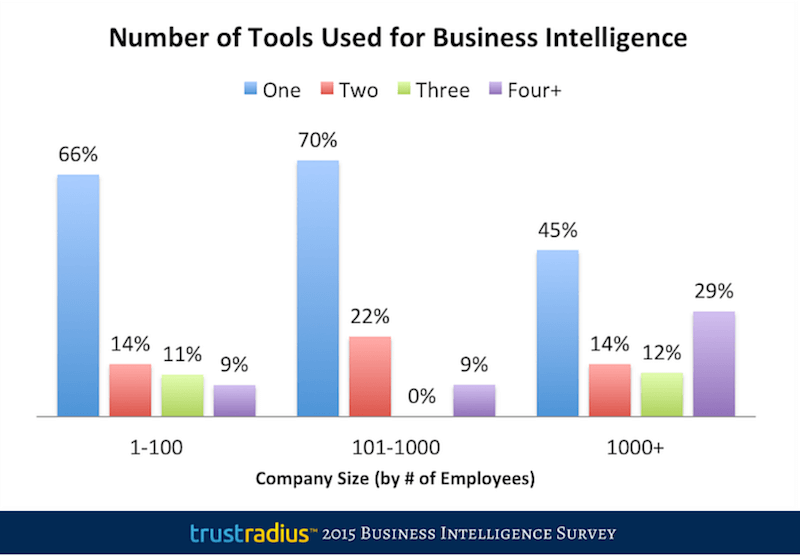
Large companies, not surprisingly, use the most BI software products, using an average of 2.5 distinct tools per company (fig. 1), with 55 percent using two or more tools, and 29 percent using four or more (fig. 2). More surprisingly, 34 percent of small companies (those with less than 100 employees) use two or more tools (fig. 2).
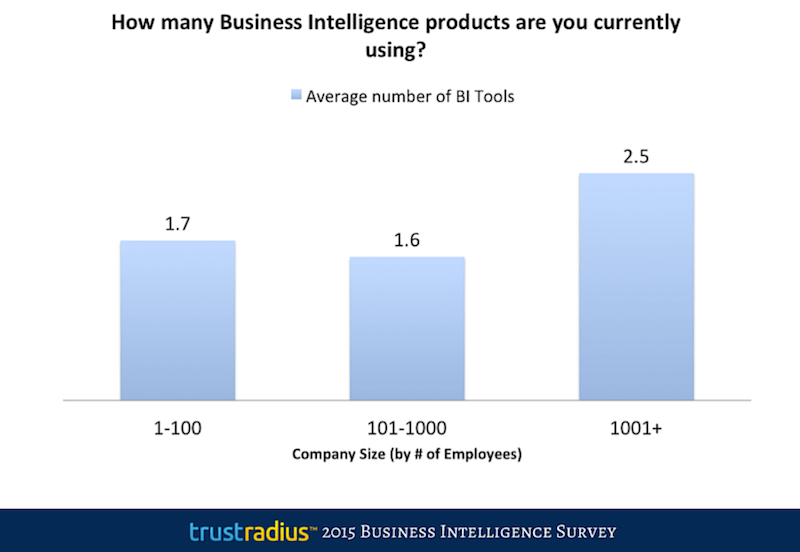
Fig. 1 – Average Number of BI Tools Used by Company Size
Fig. 2 – Distribution in Number of BI Tools Used by Company Size
2. Full-stack solutions remain the most ubiquitous
Full-stack BI products built on a data warehouse and using ETL technologies still have the largest market penetration; 60 percent of respondents use a full-stack BI software product (fig. 3). The adoption rate of full stack BI products is highest among large companies, at 74 percent (fig. 4).
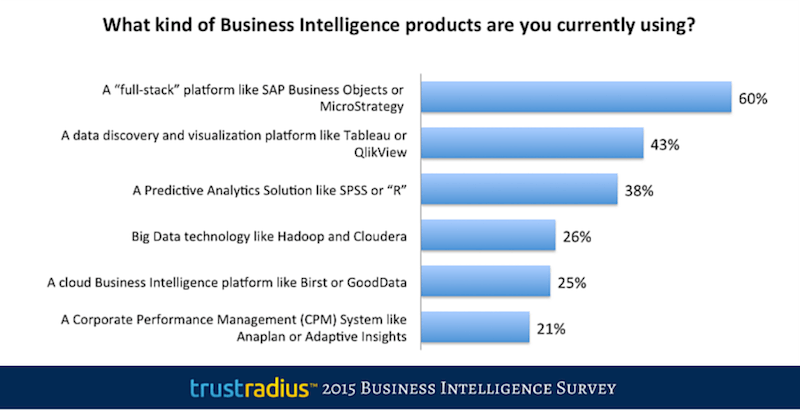
Fig. 3 – BI Tool Usage by Type – All Companies
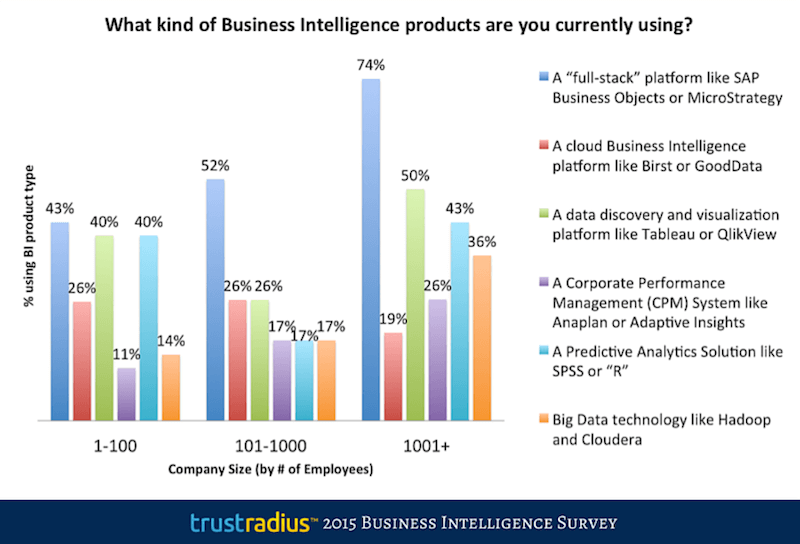
Fig. 4 – BI Tool Usage by Type and Company Size
3. Data Discovery and visualization tools are also very popular and a primary area for investment in 2015
There is high adoption of data discovery and visualization tools across companies of all sizes, with an average of 43 percent penetration (fig. 3). Interestingly, mid-size company respondents reported the lowest usage rate of data discovery and visualization tools, at 26 percent (fig. 4). This could be an anomaly among this survey sample, or could alternatively be explained by the fact that 70 percent of mid-size companies report only using one BI solution (fig. 2), and full-stack solutions are the most commonly used BI product among mid-size companies (fig. 4).
Mid-size and large companies cited data discovery and visualization tools as the most common type of BI tool investment that would be made in the next year (fig. 5). This is corroborated by the evaluation rates we see on TrustRadius by users of our site; Tableau and Qlikview – both data discovery solutions – are the most evaluated BI solutions on TrustRadius.
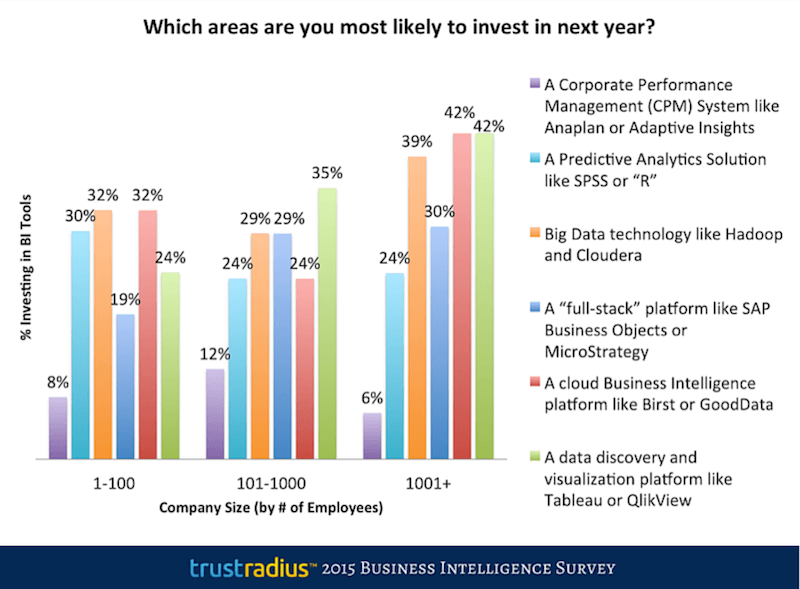
Fig. 5 – Expected Investment in BI Tools by Company Size
4. Predictive Analytics tools are also widely adopted
Predictive analytics tools are the third most widely adopted, with 38 percent of respondents reporting using them (fig. 3). Adoption levels are highest amongst large and small organizations in this sample. Approximately one-quarter of all companies plan to invest in predictive analytics solutions in 2015 (fig. 5).
5. Big Data technology is in use at more than 1/3 of large enterprises
Thirty-six percent of large enterprises are using big data technologies like Hadoop or Cloudera (fig. 4). Furthermore, Big Data technology is a key area for investment among large enterprises, with 39 percent reporting that they intend to invest in big data technology in the coming year (fig. 5).
6. Cloud BI is more widely adopted by small and mid-sized organizations, but purchase intent is highest among large enterprises
Cloud BI solutions are more widely used in small and medium-sized businesses than in large enterprises (26 percent versus 19 percent), which have correspondingly significantly higher usage of traditional full-stack BI products. However, intent to purchase a cloud BI solution is high among large enterprises – on par with discovery tools – with 42 percent indicating an intent to invest in a cloud solution this year (fig. 5).
7. Corporate Performance Management (CPM) tools are reasonably well adopted among large and mid-size companies
Twenty-six percent of large enterprises and 17 percent of mid-size companies report using CPM tools. Across the board, the intent to invest in this category significantly lags other BI tool categories (fig. 5). However, this could partly be explained by the fact that CPM purchases are generally led by the Finance team, which is a small subset of all BI users (and respondents to this survey).
8. Multiple tool users (those using 2 or more BI products) most commonly used, Full-Stack and Predictive Analytics tools.Data Discovery/ Visualization
Of companies using 2 or more BI tools, 76 percent use data discovery and visualization tools, 71 percent use full-stack, and 67 percent use predictive analytics tools. Interestingly, 50 percent also use Big Data technology. Cloud BI and CPM both lag in adoption amongst multi-tool users but are still used at a healthy rate of 36 percent (fig. 6). Data discovery and visualization tools are most commonly used alongside full-stack BI tools (73 percent of the time), followed by cloud tools (67 percent of the time) and predictive analytics (66 percent of the time) – see fig. 7. Predictive analytics is very frequently used alongside cloud BI and CPM tools (80 percent of the time in each case) – see fig. 7.
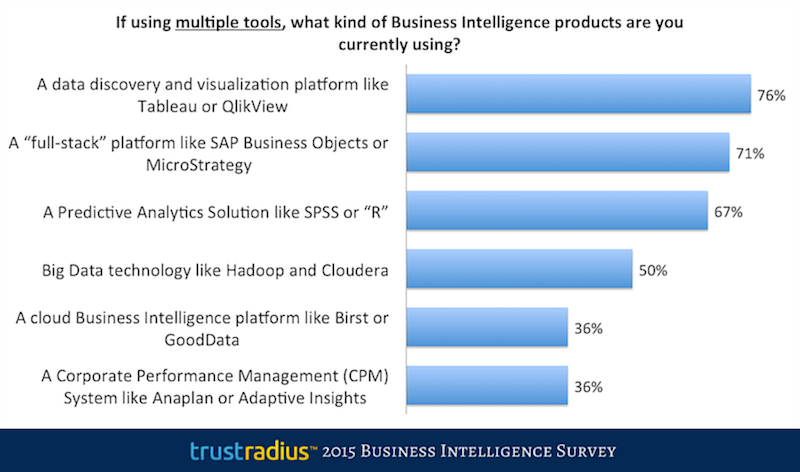
Fig. 6 – BI Tool Usage by Type at Companies Using 2+ Tools.
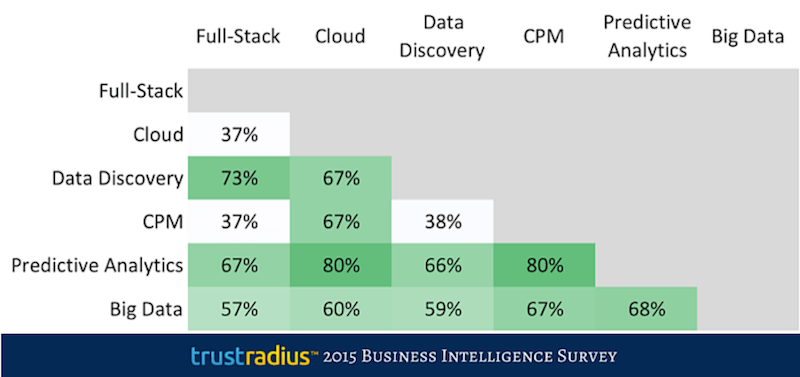
Fig. 7 – BI Tool Pairing Map (Percentage Occurrence)
9. Half of organizations plan to increase spending on BI technology
Fifty percent of the organizations surveyed plan to spend slightly more or substantially more on BI technology in 2015 (fig. 8). A higher percentage of mid-size companies (62 percent) and small companies (54 percent) plan to spend more in 2015, compared to 40 percent of enterprises (fig. 9).
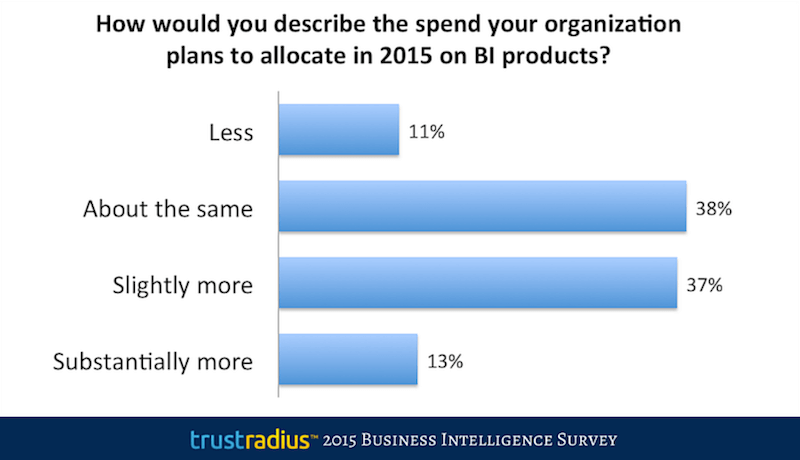
Fig. 8 – BI Tool Spend Plans for 2015 – All Companies
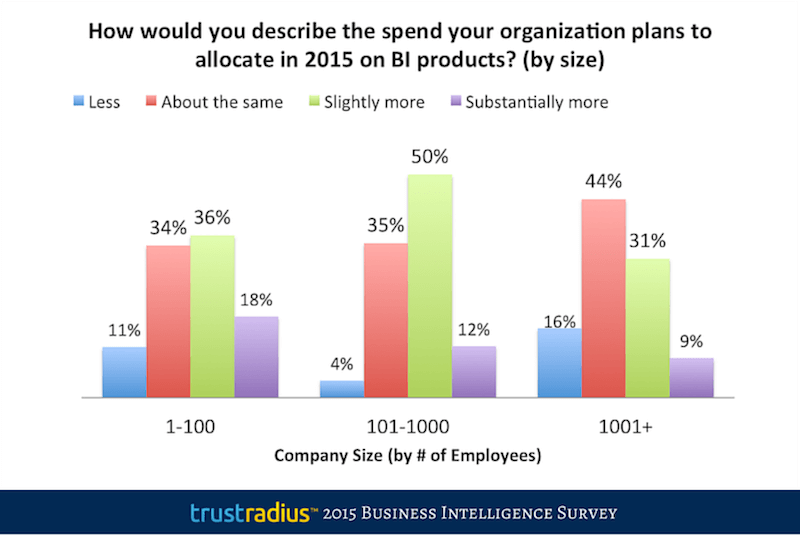
Fig. 9 – BI Tool Spend Plans for 2015 by Company Size
10. The number of employees with access to BI tools varies considerably among company size cohorts
In addition to purchasing new tool types, another area of prospective spend is expanding the adoption of tools in the enterprise. Per fig. 10, the number of employees using BI tools varies considerably across company size segments, indicating that there’s still plenty of room for expanded adoption within companies. More intuitive user interface and mobile access will contribute to this trend.
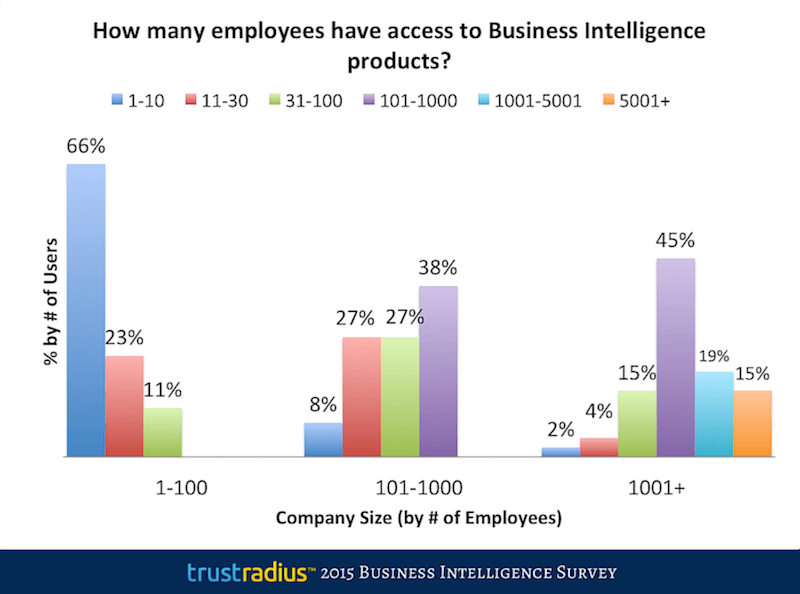
Fig. 10 – Number of Employees Accessing BI Tools by Company Size
Further resources
For detailed definitions of the various types of BI software, and a comparison of the leading products based on end-user reviews, read our Buyer’s Guide to Business Intelligence Software.
Survey details
The survey was taken by 117 respondents in Q4 2014 who are either users of BI software or knowledgeable about BI usage at their organization. Thirty-eight percent of respondents were from small organizations with less than 100 employees, 22 percent from mid-sized companies with 101 to 1,000 employees, and 40 percent from large enterprises with more than 1,000 employees.
Was this helpful?
