From Buzzword to Backbone: How AI Is Powering and Redefining B2B Search and Buying
AI is the ultimate corporate buzzword in 2025, and at the same time, it’s a revolution. Leaders are asking how teams can push the boundaries of the possible with AI, but being more efficient with it is at the top of the list. AI has become the latest positioning for marketing, calling out “AI-enabled” this and “AI-powered” that, but how are people actually using AI to make their work and personal lives easier? We surveyed the TrustRadius buyer community to find out.
We also went one step further, gathering data on how software buyers leverage AI as a part of their buying journey. Read on for insights, both on how users are leveraging AI tools (and those AI features your product team likely has on the road map) and how buyers are using AI behind the scenes throughout the buying cycle.
The AI age has arrived
Of respondents who indicated they use AI at work, 95% use it at least weekly and 69% use it daily. If you’ve read our report From Boomers to Zoomers: Gen Z Enters the Software Buying Process, you won’t be surprised to hear that our data indicates that younger professionals are more likely to use AI at work. 86% of Gen Z respondents (born between 1997 and 2005) said they use AI daily.
Daily usage varies widely based on job function as well. More technical roles (engineering and product) are more likely to use AI daily, while finance professionals are the least likely.

This trend makes perfect sense. Engineers possess both the technical knowledge and the necessary permission to innovate and test new technologies. Plus, many of the AI tools on the market were created to serve technical use cases, such as writing and troubleshooting code. Finance professionals don’t have as many options for AI tools to help with their specific roles, and are more likely to face stricter regulatory requirements, making the adoption of AI tools a more challenging process.
Which AI tools do professionals use?
We’ve established that a large number of professionals use AI in their day-to-day work. ChatGPT is the most commonly used tool, but several other large language models (LLMs) are frequently used as well.
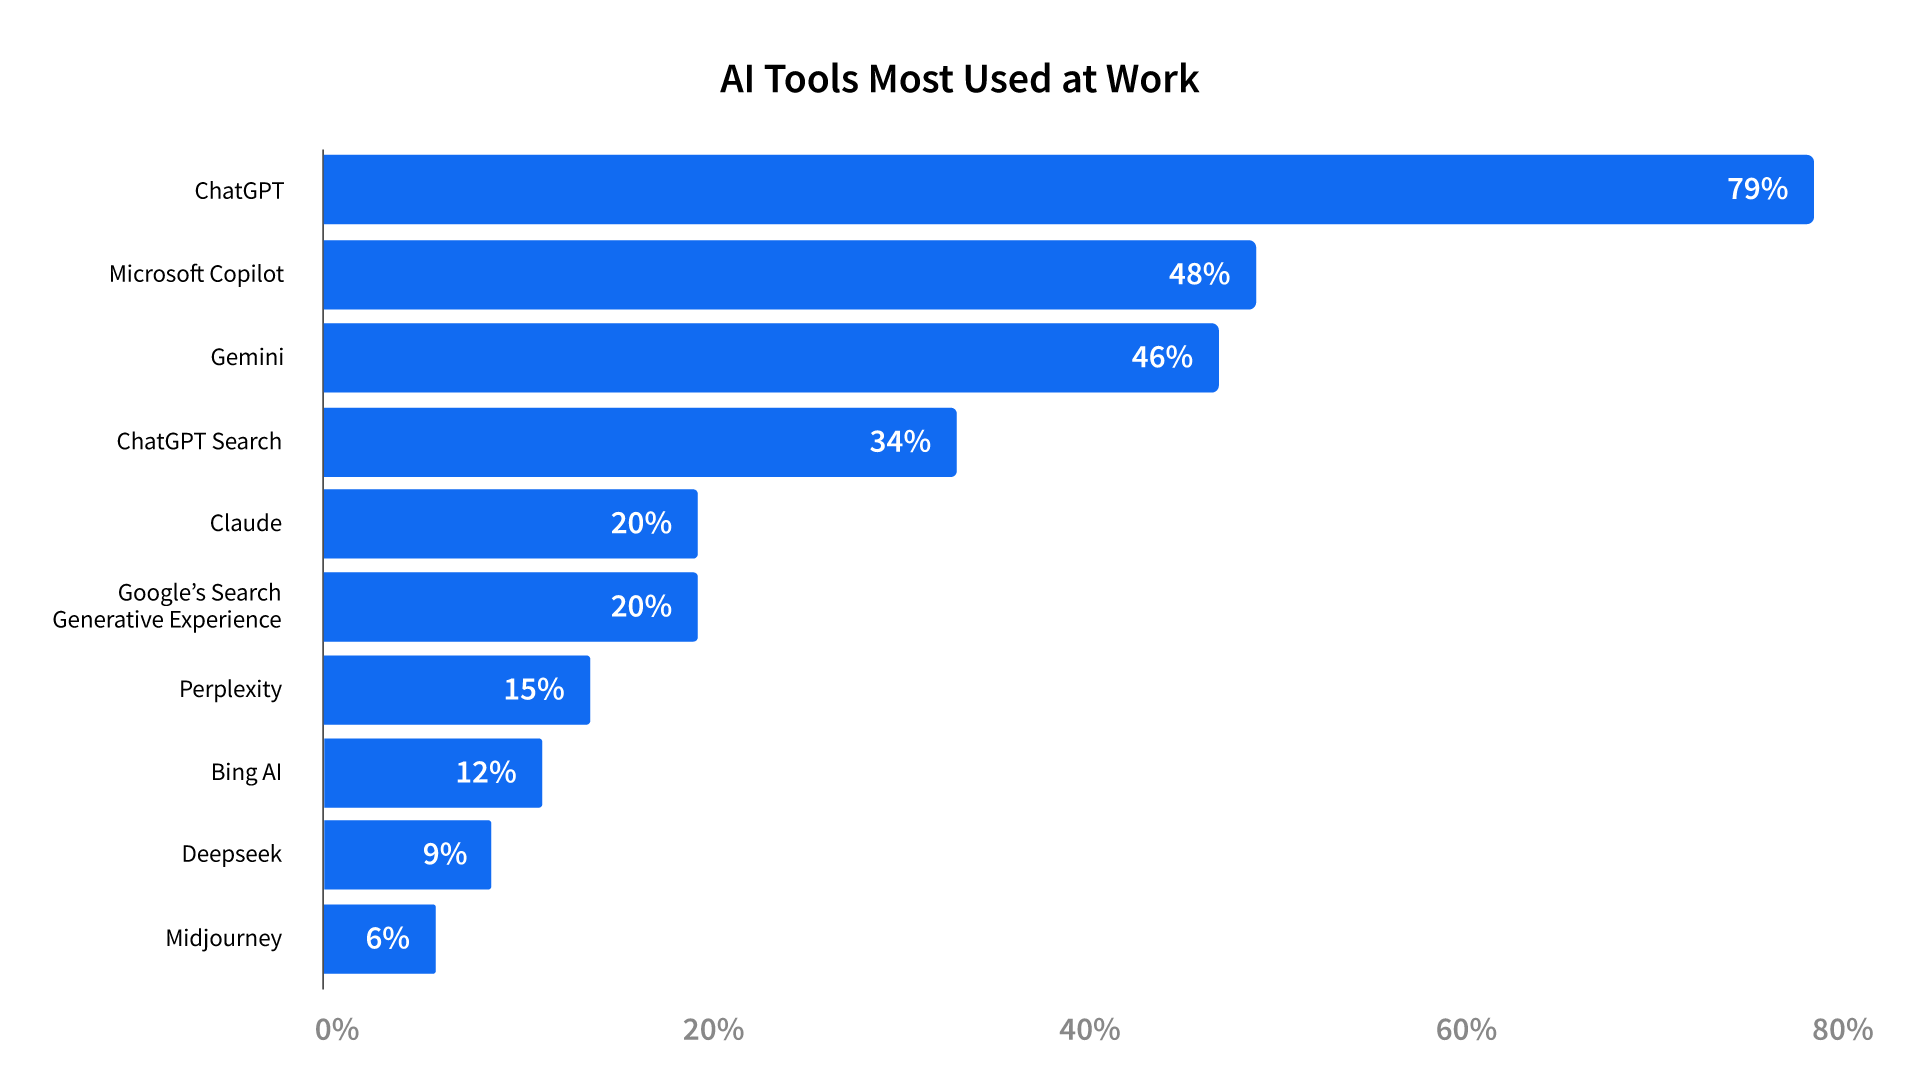
Notably, enterprise users (those who work at companies with at least 1,001 employees) are more likely to use Copilot and Perplexity.
Most folks aren’t using just one tool, though. The average respondent in our survey uses three different AI tools. As we saw with usage, there are interesting demographic trends in this data as well.
Generational differences
Gen Z respondents use an average of 3.6 tools, and baby boomers use 2.3. While we don’t have data to confirm the reason for this trend, we think it’s unsurprising, given that Gen Zs are more likely to use these tools daily. We think they’ve experimented and use the tool that’s best suited for their individual tasks.
Innovation in the C-suite
Members of the C-suite use an average of 3.9 tools, while this number was 2.6 for individual contributors. Our speculation here is that the C-suite is likely involved in testing out tools for various use cases before making a department- or company-wide investment in the tool. Based on our prior research, a member of the C-suite is on the buying committee the majority of the time a software purchase is made. The C-suite is also most likely involved in setting the company’s AI policy (more on that later), and may try various tools throughout that process. Individual contributors are likely only using the tools their company provides a paid subscription for or free tools that are allowed under the organization’s AI policy.
Less regulation = more AI
Product, engineering, and marketing teams use an average of 3.5 tools, while this number is 2.6 for HR and finance teams. HR and finance teams are likely subject to more regulations than product, engineering, or marketing teams. They are likely leveraging AI tools approved by the company’s AI policy, and for fewer tasks. After all, nobody wants their personally identifiable information (PII) leveraged as training data for ChatGPT.
Trends across the board
In all cases, we speculate that people are testing various AI tools to determine which one(s) work best for their unique use case. Given the prevalence of free versions of the most popular tools listed above, testing doesn’t require a large investment of time or money.
That said, many people aren’t just using standalone AI tools. 75% of our sample said they use tools that offer AI features, and only 9% of this group stated they don’t use the AI features offered. This is good news for companies investing in AI innovation for their products, as it shows that their customers are open to trying new AI features. The most common use cases for AI features were:
- Writing assistance (24%)
- Summary generation (19%)
- Search (18%)
- Image, video, and audio editing (15%)
- Coding (15%)

What about non-users?
As with all new technologies, there are AI skeptics. Respondents to our survey who don’t use AI at work cited reasons such as liking to do things their own way, concerns with reliability or accuracy, or that their company does not allow AI tools to be used.
| “There is not a handle statement or good practice about AI uses in my organization, but a lot of sensitive data could leak.” – Manager in Finance and Accounting, 5,001-10,000 employee company | “I have tried LLMs a few times and every time the answers I got were completely wrong and/or made up.” – Manager in Engineering, 11-50 employee company | “I don’t know how they would be applicable to my job responsibilities.” – Manager in Operations, 51-200 employee company |
How is AI used?
Now that we know which AI tools people are using at work, let’s talk about how they use them.
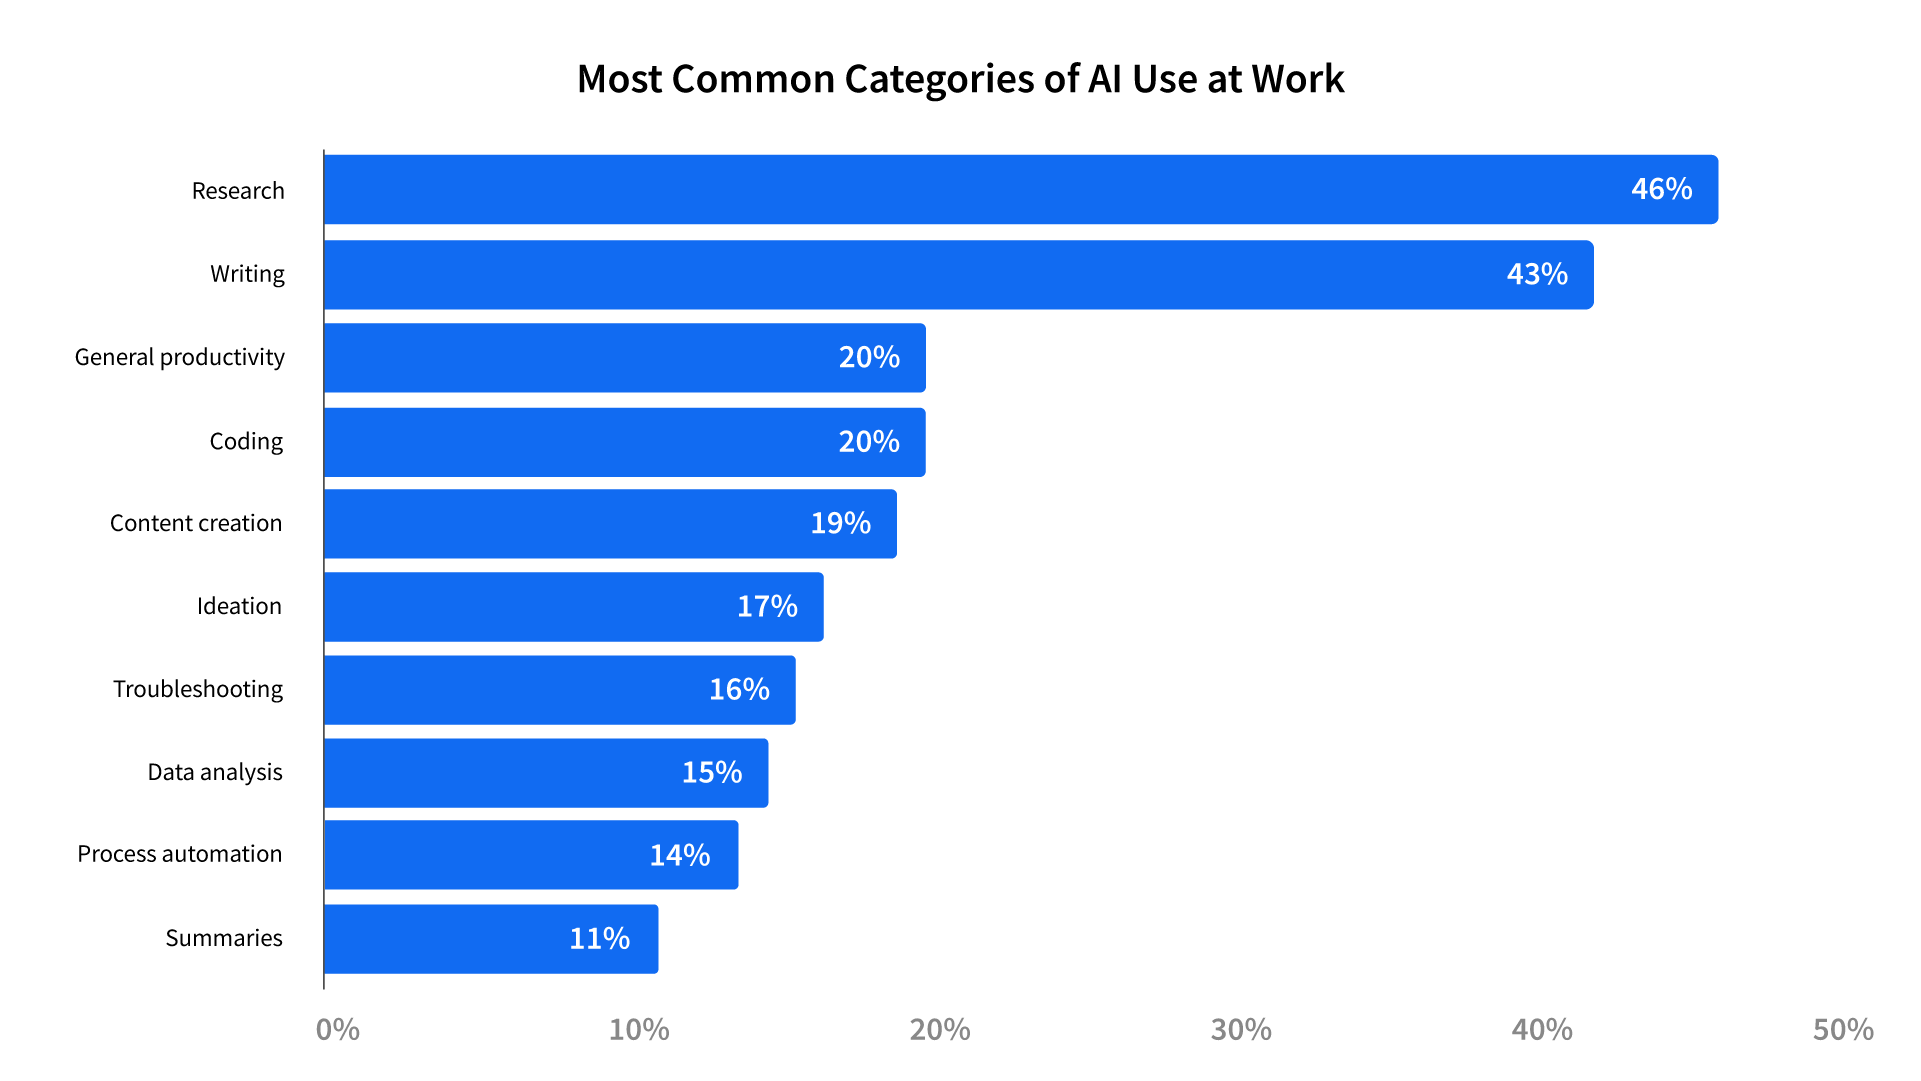
As with the number of tools used, use cases also vary across generations. 71% of baby boomers said they use these tools as a research replacement. Gen Z often uses these tools for brainstorming (27%) and problem solving (27%).
Based on the survey responses, we believe that AI use cases are still developing rapidly. 84% of AI users in our sample said they have questions they would ask an AI expert. There were a few common themes in these responses:
- Developing AI use cases (18%)
- Role- or industry-specific questions (17%)
- How to leverage AI in their workflows (16%)
- How to increase productivity with AI (15%)
- How to improve prompts (14%)
These responses tell us that while AI is seemingly everywhere, so are questions about best practices, use cases, and more.
How are tech companies responding to the AI age?
Tech companies are fully embracing the AI age. Beyond the push to develop and release AI features, companies are investing in AI tools for their employees. 78% of respondents said that their company pays for at least one AI tool.

While people are more likely to use ChatGPT (79%), 33% of our sample said their company pays for their subscription. Microsoft Copilot and Gemini are also frequently purchased by employers.
AI in the enterprise
Enterprise organizations have a reputation for being slow and bureaucratic. Based on our data, that does not hold true for AI adoption. 90% of enterprise employees in our sample said that their company pays for at least one AI tool. 60% of enterprise employees said their company pays for Microsoft Copilot, likely because many enterprise companies use Microsoft Office, which is now bundled with Copilot in the same subscription.
AI innovation and goals
We asked our community why their companies were adopting AI and what they were trying to achieve. The most common goals were driving efficiency (86%), innovation (57%), and saving time and money (47%).
These companies are aiming to achieve this through both implementing and adopting AI tools and developing their own. 32% of respondents work at companies that are developing proprietary AI tools for internal use cases. Unsurprisingly, this number is higher in the enterprise (54%), as these companies likely have more resources to allocate to these endeavors.
Use cases for these internal tools varied, but were largely focused on automation and efficiency.

Adoption =/= free reign
Businesses large and small are adopting, and sometimes developing, AI tools. This doesn’t mean there’s an AI free-for-all going on. 51% of our sample said their company has a policy that governs their use of AI at work. The larger the company, the more likely they are to have a policy, with 72% of enterprise employees saying their company has an AI policy.
Generally, these policies are well-received. Only 7% of respondents said their company’s policy is unclear, and only 15% said they are too restrictive. 30% of our sample said that their company’s policy emphasizes data security. To us, this means that companies are looking for the right way to balance innovation with security, and for the most part, their employees feel like they’re hitting the mark.
AI in the buying journey
AI is being used for more day-to-day tasks, including software buying. 45% of our sample and 51% of enterprise buyers have used AI in their software-buying processes. Given how much online search has changed since the introduction of ChatGPT and other tools like it, it’s vital for technology companies to understand their AI visibility. After all, there’s no way to make the short-list if a buyer doesn’t know who you are. To make matters more urgent, younger Gen Z buyers (51%) and those in the C-suite (65%) leverage AI more often in their buying processes. This means that both the early-stage researchers and the final decision-makers are leveraging AI tools to evaluate your product.

Which AI tools are used for software buying?
For the most part, the AI tools leveraged for software buying are similar to those used for day-to-day work. We think this is because buyers are leveraging the tools they already use and are familiar with, as well as the ones their company already pays for.
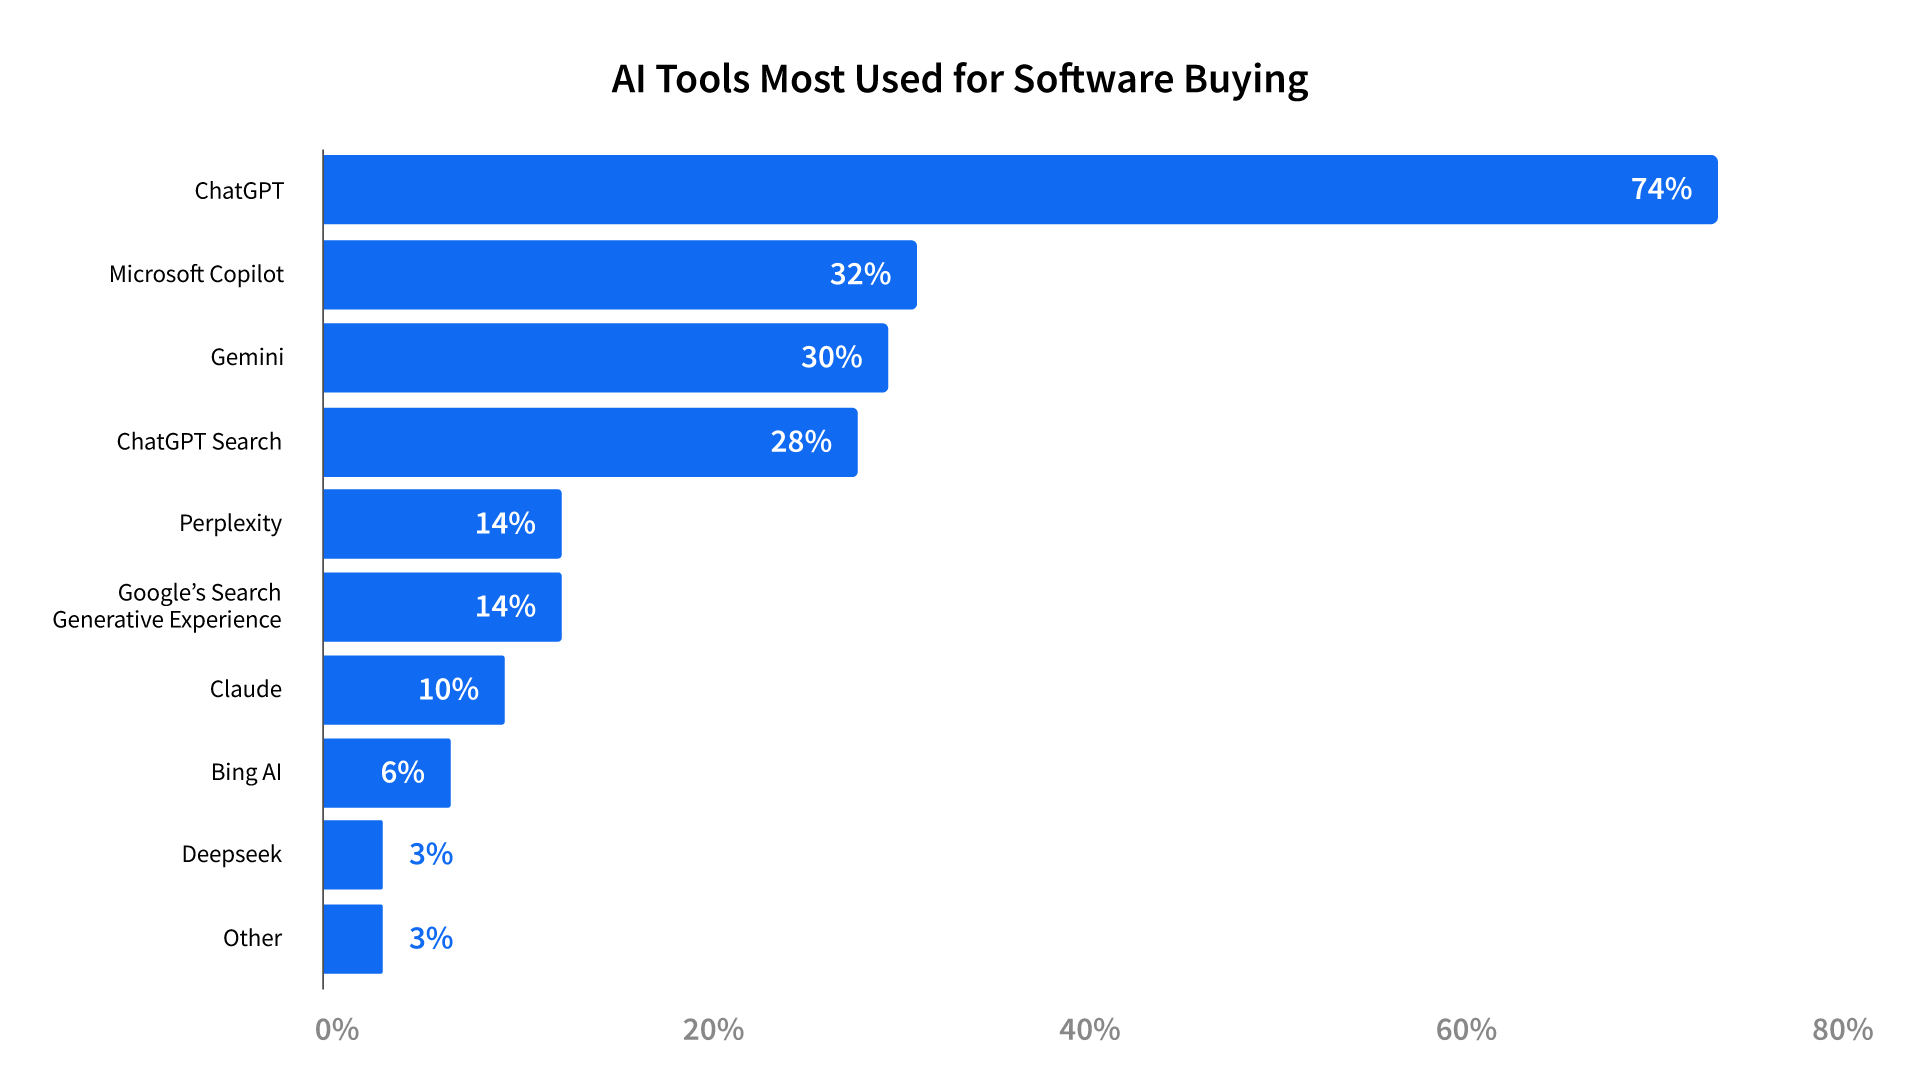
As with general AI usage, Microsoft Copilot (45%) and ChatGPT Search (36%) are more popular with enterprise buyers.
How is AI used for software buying?
Buyers are still figuring out how to leverage AI for software buying and are experimenting with it in a wide range of use cases, from preliminary research to final decision-making. 94% of buyers in our survey who use AI find it helpful or very helpful.
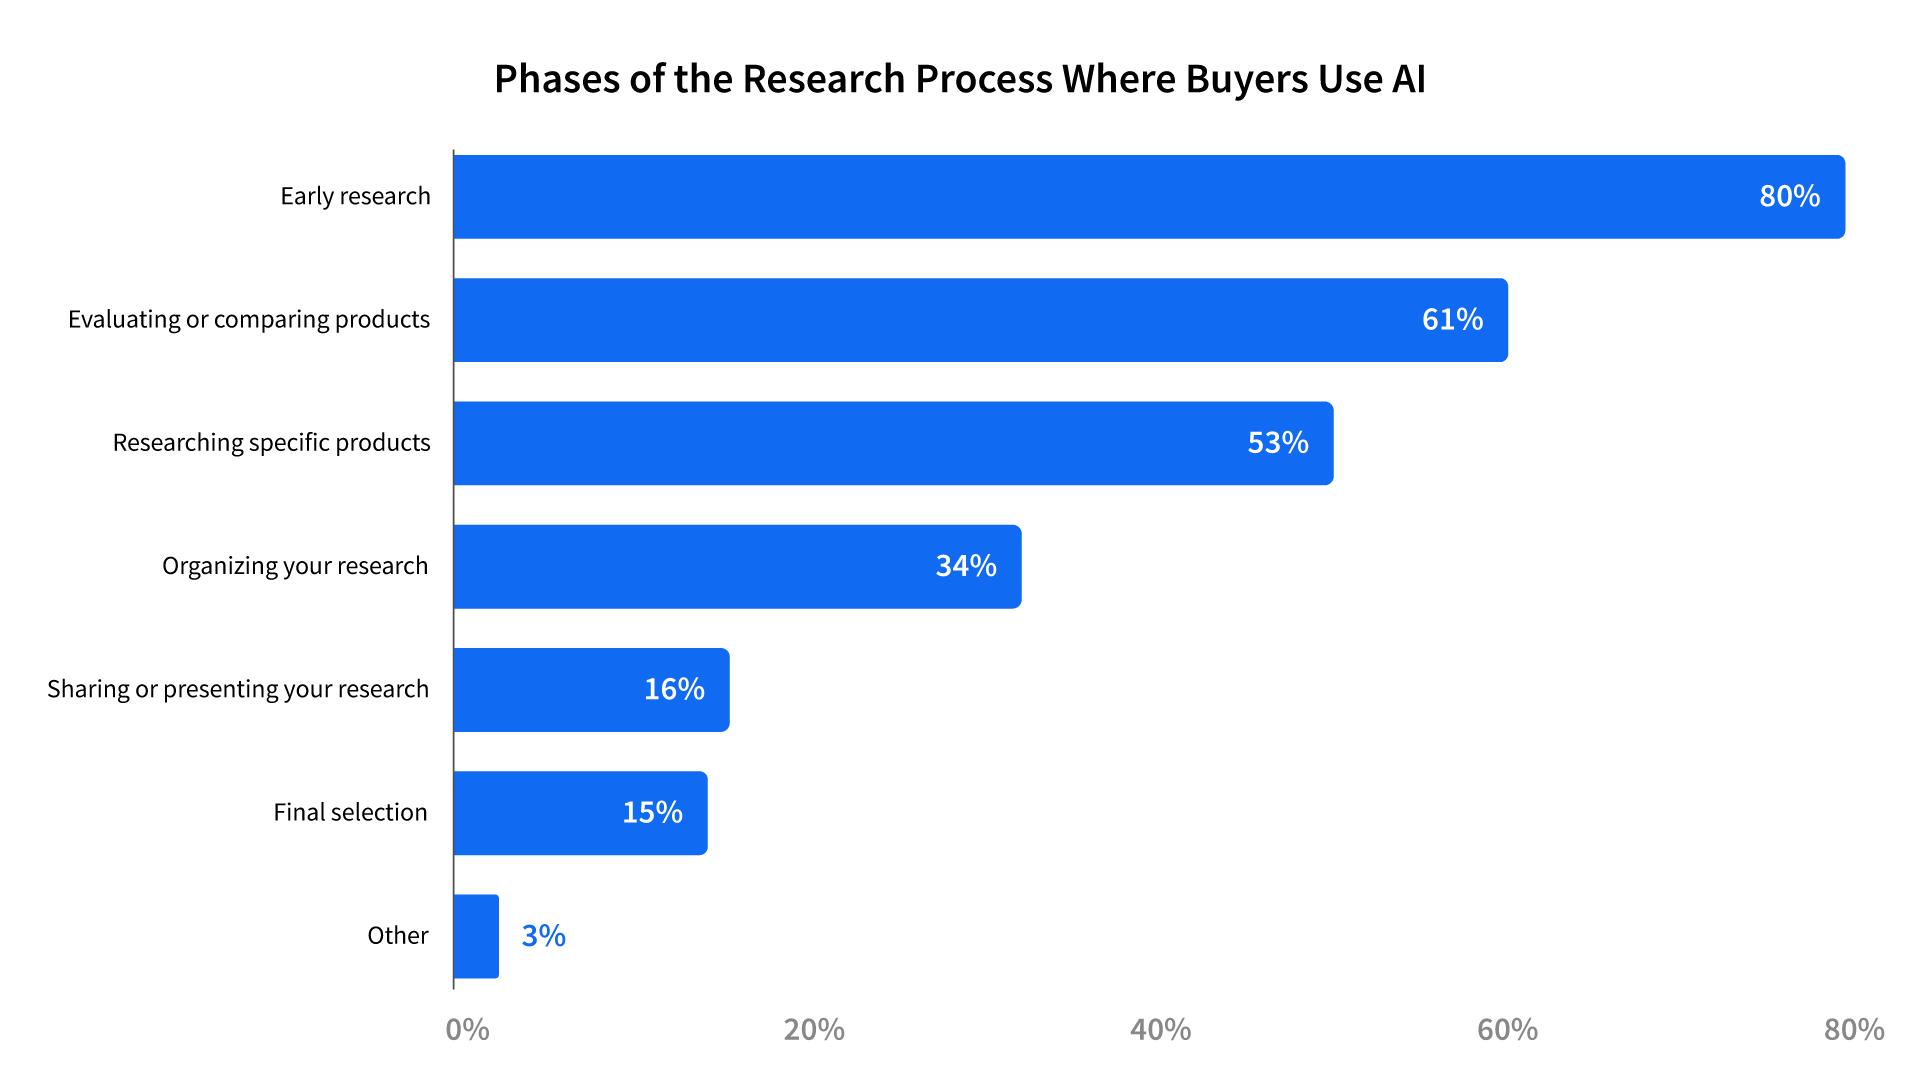
Early research is the most common use case. This use case is also where AI is taking over traditional search. Buyers are turning to AI tools to give them the lay of the land and let them know which products are out there. Showing up in this preliminary research is vital for vendors who want to stand a chance of making the short-list and ultimately closing the deal.

Comparing products and doing deep research on specific products are in the #2 and #3 spots, respectively, and we think they go hand-in-hand. Moving toward a short-list requires a deep understanding of what’s available in the market and how those products stack up against each other.
This can be daunting for vendors. After all, this means it’s important to ensure that these LLMs have access to content that shows both your product’s strengths and where it beats out the competition. A focus on user-generated content (UGC) can help here. After all, who better to advocate for your product’s strengths than someone who uses it?
In addition to showing up in LLMs, UGC is vital for the fact-checking stage. Per our annual Buyer Research Report, most AI users check the outputs against other sources. Social proof is also key in building confidence in Gen Z buyers as they rely more heavily on reviews, user conversations, and forums than previous generations.

Organizing research can be a daunting task for software buyers, especially in the enterprise where budgets are scrutinized and buying committees are larger. There’s a ton of information to gather and keep track of, and no industry-standard process to guide the buying journey. Buyers are leveraging AI to organize the research they’ve done cohesively. This is even more frequent in the enterprise (40%).
Sharing and selection are the final two, and least common, use cases. Once the research is done and organized and the products are compared, buyers need to share it with their buying group and make a decision. Based on our research, some buyers are leveraging AI for this, but given the prevalence of fact-checking, most aren’t ready to trust AI to decide for them just yet.
How does AI help (or hurt) in the buying journey?
Here’s what real buyers told us about why they did (or didn’t) use AI for their software-buying process.

Predictions for the future
In a prediction that will shock the world (and by the world, we mean absolutely no one), we believe AI usage, both in work and in software buying, will continue to become the status quo. AI is just like any other tool—people are open to using it if it’s helpful, and resistant to using it for a job it’s ill-suited for.
AI features must deliver
Automating workflows and simple tasks are key use cases for AI in both day-to-day work and software buying. We predict that AI tools and features that support these use cases will continue to grow in popularity. On the flip side, we think a lot of technology companies will release AI features that fall flat. Users will see through AI features that were built simply so a product can be called AI-enabled, but don’t add real value.
The shift in search is permanent
Google’s dominance is waning, and it’s not likely to regain its share of influence. This, along with shifts in the Google algorithm, paints a bleak picture for search engine optimization (SEO). Not only is it harder to get visibility, but there’s less traffic to go around if you do get your content in front of people. Companies need to have both traditional SEO and generative engine optimization (GEO) strategies. If this sounds like twice the work, it is, but only kinda. Having clear, helpful, authoritative, and insightful content will help you on both fronts. Tracking success is where the extra work comes in.
GEO is a whole new ballgame, and the industry is still trying to figure out the best way to track brand visibility in AI search and LLM responses. There are a number of startups aiming to provide this insight to their customers. GEO monitoring tools are likely to become their own distinct category, and we expect some hybrid SEO/GEO tools and services to continue to come to market in the next few years.
Content is king
Google is no longer rewarding quality content with traffic and views. AI models don’t always give attribution to the sites they leverage for their responses. This can be demoralizing for content professionals and makes it seem like there’s limited ROI to be gained from a strong content strategy.
Despite this, we think that content is more important than ever. Having content about your product across various channels is the best way to control the narrative and improve your brand visibility. LLMs are great at summarizing and restating data from their training material. Even if you’re not getting clicks, you will benefit from ensuring the narrative presented in these LLMs represents your brand favorably.
Most LLMs are scraping sites in real time to answer user questions. This should address the concern that the info these LLMs present is outdated and give brands more opportunity to adjust how these tools present them.
LLMs will give back
This may be a hot take, but the current status quo can’t stand. It’s not sustainable for any brand to continue supplying content to LLMs (like they did with traditional search engines) without gaining the benefits they received from traffic to their site. We think that there will need to be some sort of value exchange between content producers and AI companies.
10 key takeaways
- 75% of AI users also use products with AI features.
- Most AI users leverage three different tools on average.
- 78% of AI users have company-funded subscriptions to AI tools. This number is greater for the enterprise, at 90%.
- 45% of AI users have used AI in their software-buying process.
- 32% of all respondents (and 54% of enterprise respondents) said their employers are developing proprietary AI tools
- ChatGPT is the most commonly used (79%) and the most commonly paid for (33%) AI tool.
- 94% of respondents who use AI for software buying said it was helpful or very helpful.
- 69% of AI users use it daily.
- The most common use case for AI in both daily use (46%) and software buying (80%) is research/search replacement.
- 51% of all respondents (and 72% of enterprise respondents) said their employers have an AI policy that dictates how they can use AI at work.
Methodology and demographics
Data for this report was sourced from the TrustRadius global network via an online survey. In August 2025, we sent online surveys to professionals from our buyer community through our social media channels.
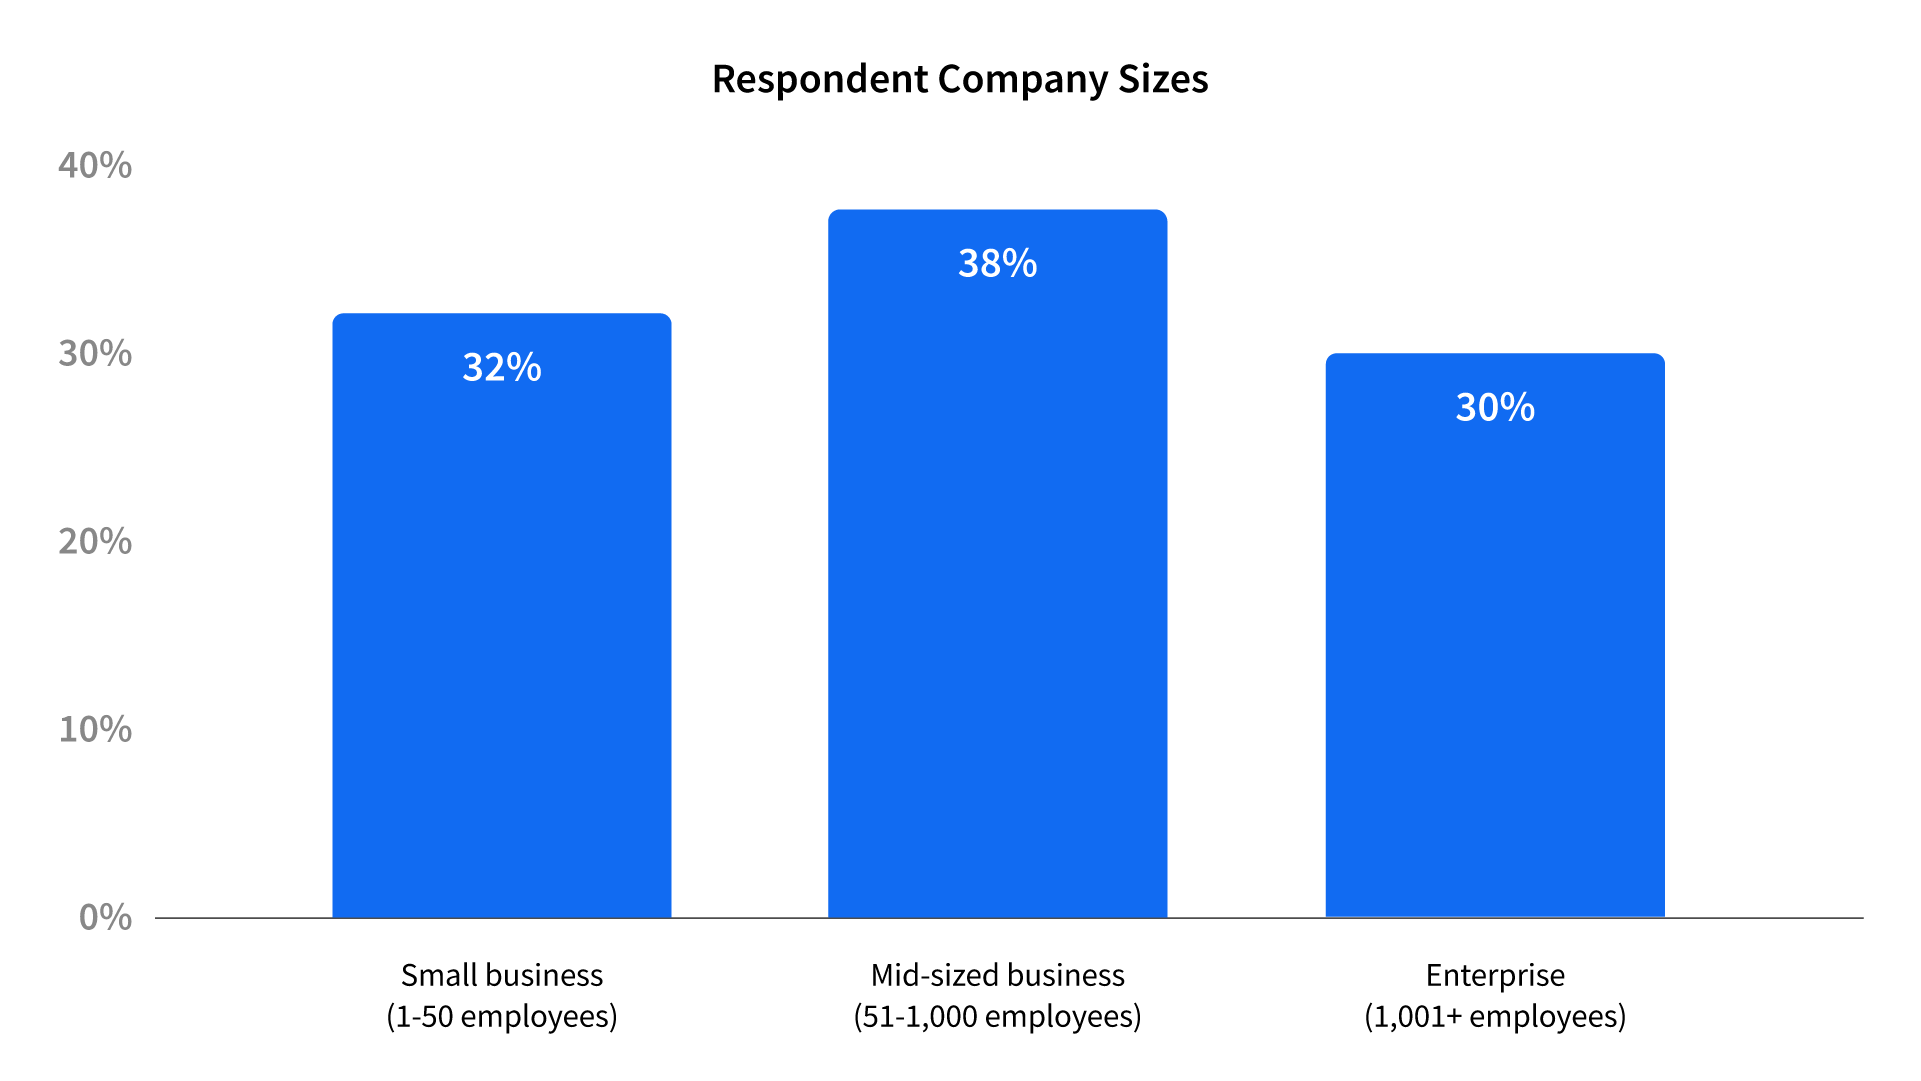
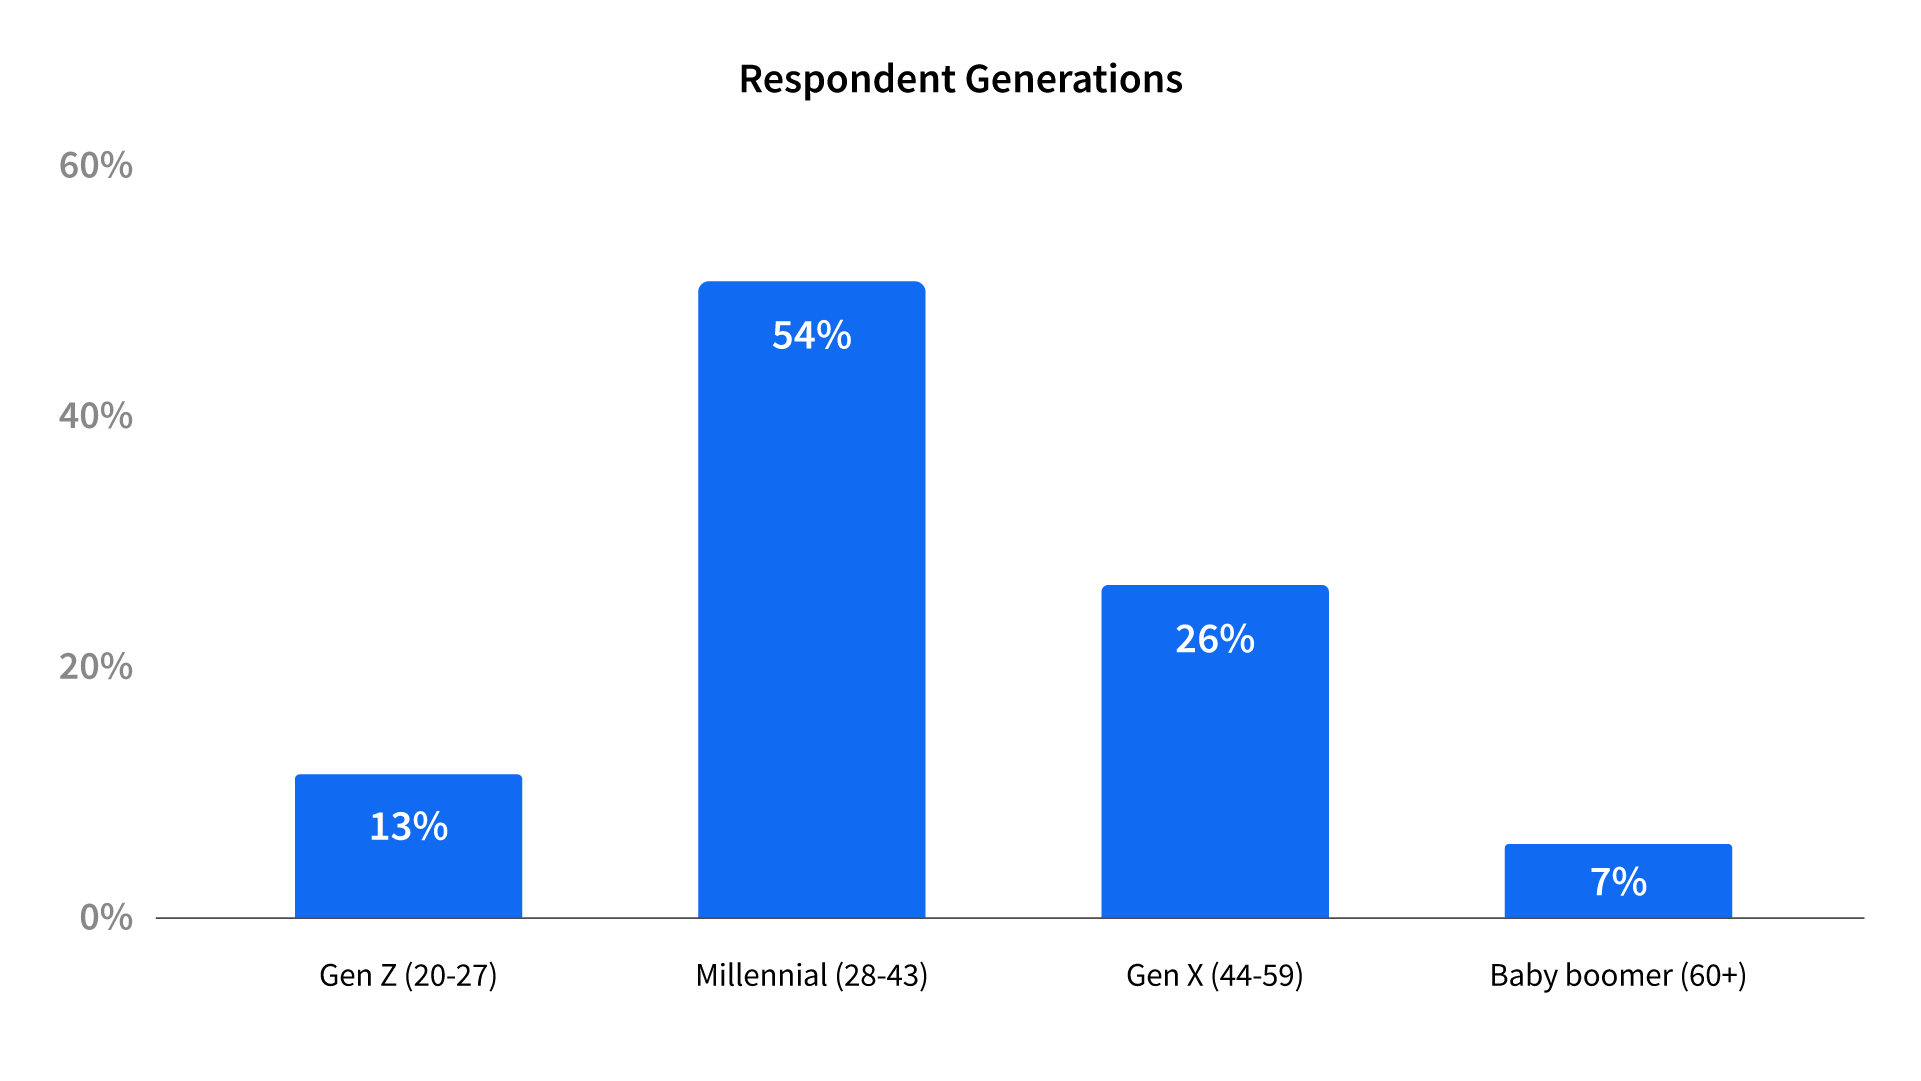
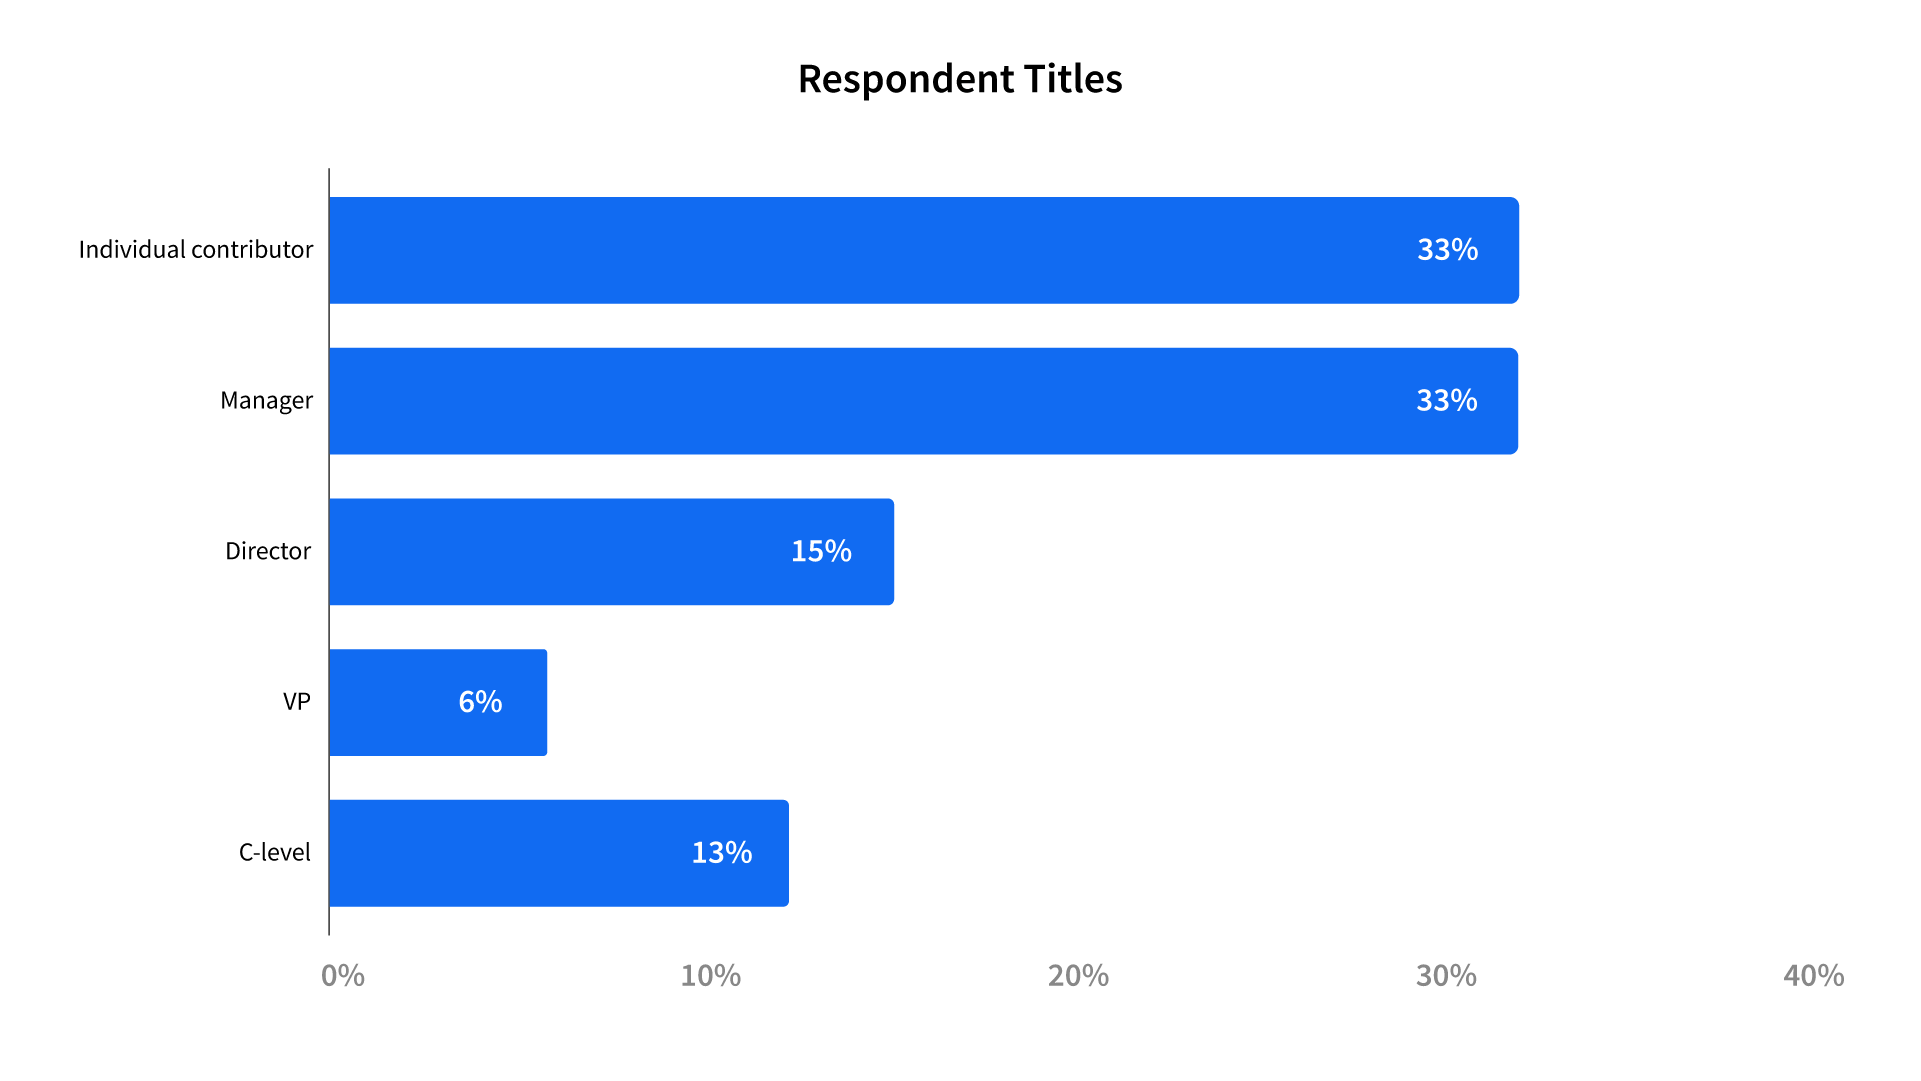
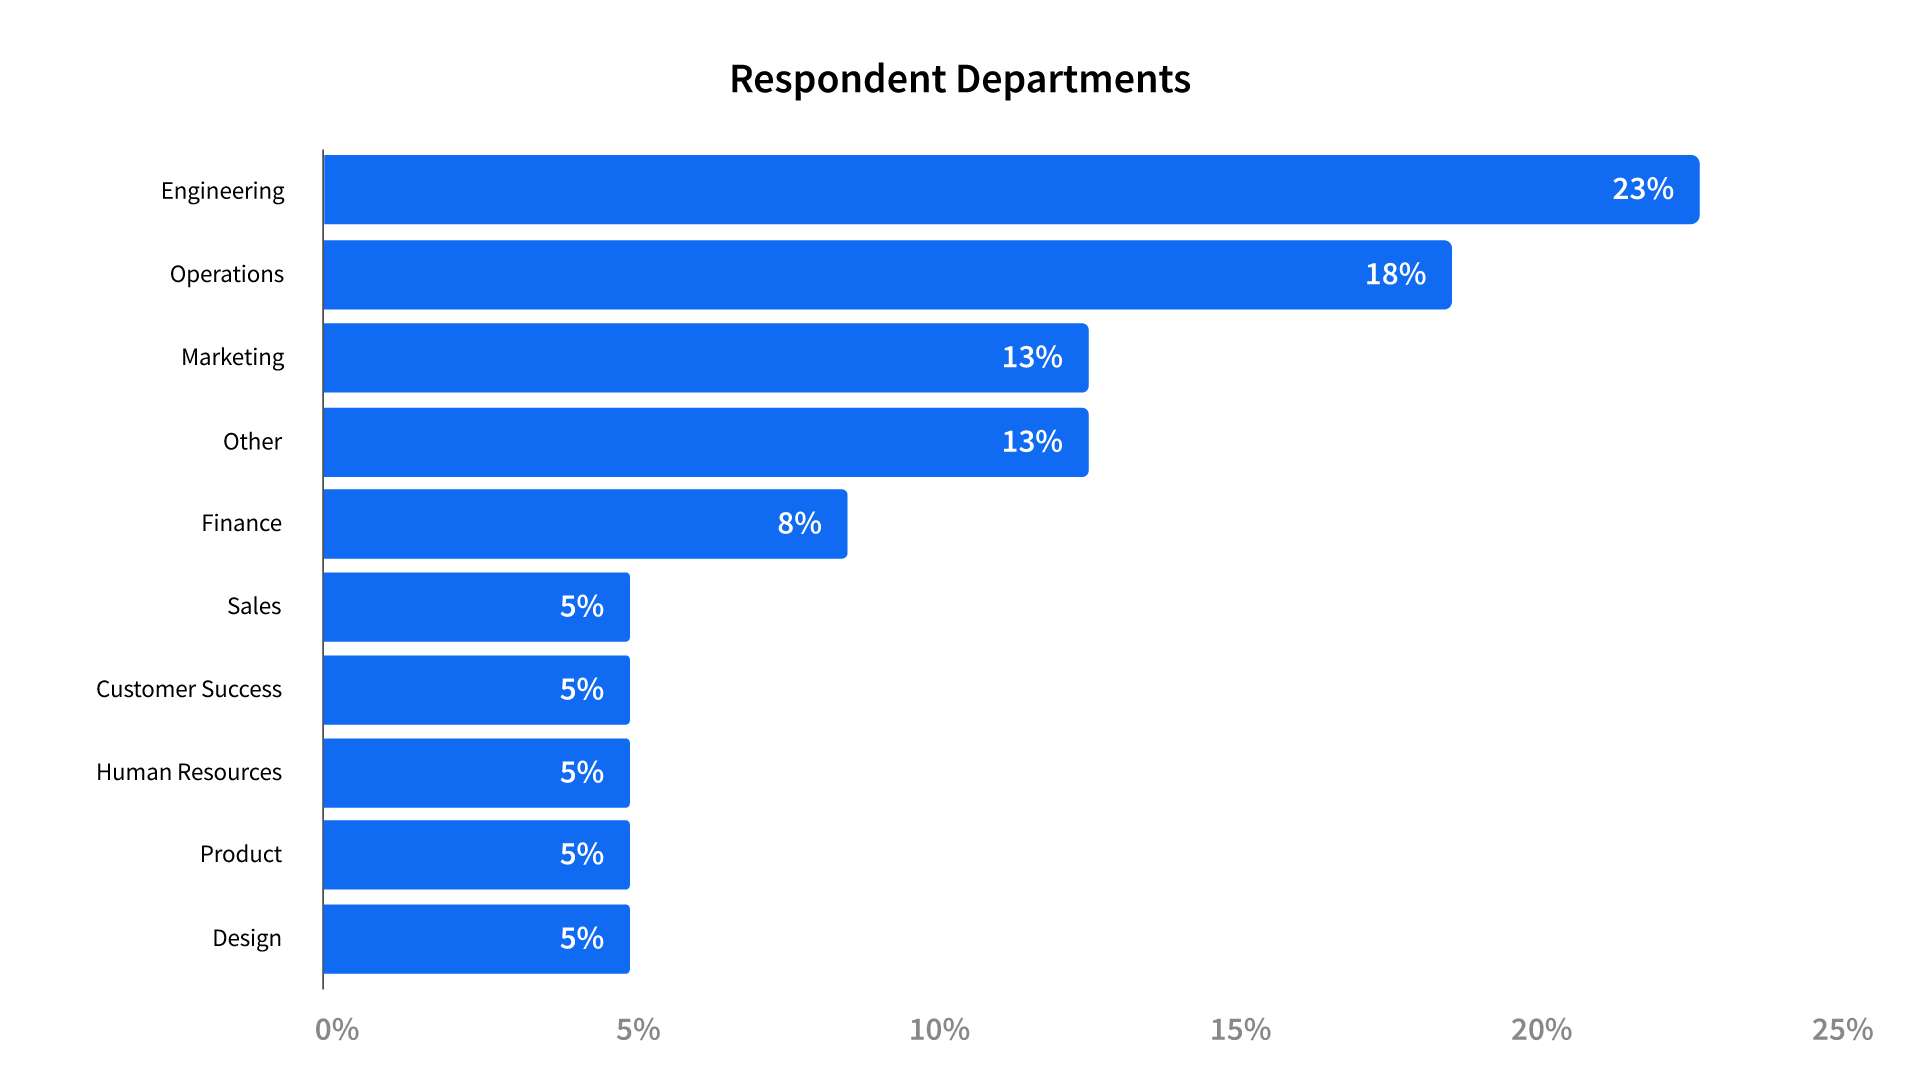
We received 348 complete and verified responses in total. All respondents were offered a nominal incentive ($10 gift card) as a thank-you for their time. We’ve included information below on the demographics of our survey respondents. For a full list of survey questions and answer choices, or if you have any questions about the data, email us at research@trustradius.com.
