
Beyond the Hype: The AI Bubble that Isn’t Bursting (Yet)

Rajat Bhatnagar
SVP, Growth
HG Insights
A decade of B2B buying research allows you to see the moments when a trend tips from “emerging” to the new normal. This is one of those moments.
AI is now a common research tool for B2B technology buyers. It’s clearly a standard part of how buyers are evaluating and validating decisions for the foreseeable future. But adoption hasn’t bred complacency. 94% of buyers who used AI to research a purchase still fact-checked what it told them.
Buyers are using AI to move faster, not to think less. They want the efficiency of AI synthesis and the confidence of verified sources, and those two things have to coexist.
For vendors, that changes where and how the game is played. SEO built on keyword volume and backlinks was already showing its age. Visibility is now earned through Generative Engine Optimization (GEO), which means getting your brand surfaced accurately in AI-synthesized answers. And the input that AI systems draw from matters, too: 74% of buyers still use peer reviews to inform purchase decisions. The LLMs understand this, which means authenticated customer voice is training data for the AI your buyers are already consulting.
TrustRadius and HG Insights sit at the center of the answer to both problems. Verified review content gives AI systems a signal worth surfacing. Technographic intelligence shows where demand is forming before buyers start searching. Vendors who operate at that intersection will be visible when it counts.
That’s what this year’s report is about. The disconnect between buyer behavior and vendor strategy is real, and in some places it’s getting wider. Here’s where and what to do about it.
Some Things Change, Some Things Stay the Same
Software buying looks nothing like it did 10 years ago. The tools are different, the signals are different, and generative AI is rewriting the rules faster than most vendors can keep up.
But dig into the data, and something stubborn keeps showing up: buyers still don’t trust vendor collateral. They want real, use-case-specific insights from people who have actually used the product. That was true before the AI boom, and it’s still true now.
That gap between what vendors produce and what buyers actually need is why TrustRadius, an HG Company, exists. And if anything, the noise of an AI-first world has made closing that gap more urgent, not less.
Same Resources, More Variance.
Buyers are using roughly the same number of resources as they did previously; on average, they are consulting 4.7 resources (compared to 4.6 in 2025). Likewise, the top 5 resources consulted have not changed, though usage of these resources is slightly down for product demos, user reviews, and vendor/product websites. Notably, vendor marketing collateral ranked last.

Almost every resource consulted is down 2-3% in usage frequency, except for AI tools and AI search. Neither of these make the top 5 just yet, but to us, this increase means two things: 1) that more buyers are incorporating AI into their buyer journey than ever before, and 2) buyers are seeking out roughly the same number of resources, but the variance across these resources is growing.
Long term, we expect to see AI tools and AI search continue to keep climbing the list of most consulted resources. That said, we doubt these tools will become a one-stop shop for software buyers. The most influential resources were still those that gave buyers firsthand or secondhand experience with the tool, something AI simply can’t replicate.

Free trials, demos, and prior experience (aka resources that give users first-hand knowledge of how a product works) were the most influential resources for software buyers. User reviews and asking a friend or peer also cracked the top five.
This tracks with everything we’ve seen over the past ten years as the trust gap between buyers and sellers has grown. Buyers don’t trust the marketing materials vendors produce, so they are swayed by resources that let them see the product in action firsthand. In some cases, a free trial or demo may not be available, which is when buyers likely turn to reviews and trusted peers for insights that they can’t get elsewhere.
Besides vendor-created marketing collateral, the least influential resources were AI search, AI tools, and search engines. Rather than interpreting this as these tools being unhelpful, consider where they fit in the journey: they help buyers identify what type of tool to purchase, build a shortlist, and organize research early on.
The final decision will likely be made based on one of the resources discussed above, but vendors can’t afford to neglect these early-stage resources; they are essential entry points into the research and purchase process.
“Buyers value trials and demos because they help them learn and build confidence. Vendors value sales because that is where deals move forward. Both are right. The difference is sequencing. I have shifted more budget toward LLM-optimized content, peer reviews, third-party validation, and self-service paths that create better educated prospects before they reach sales.”
AI in the Mix
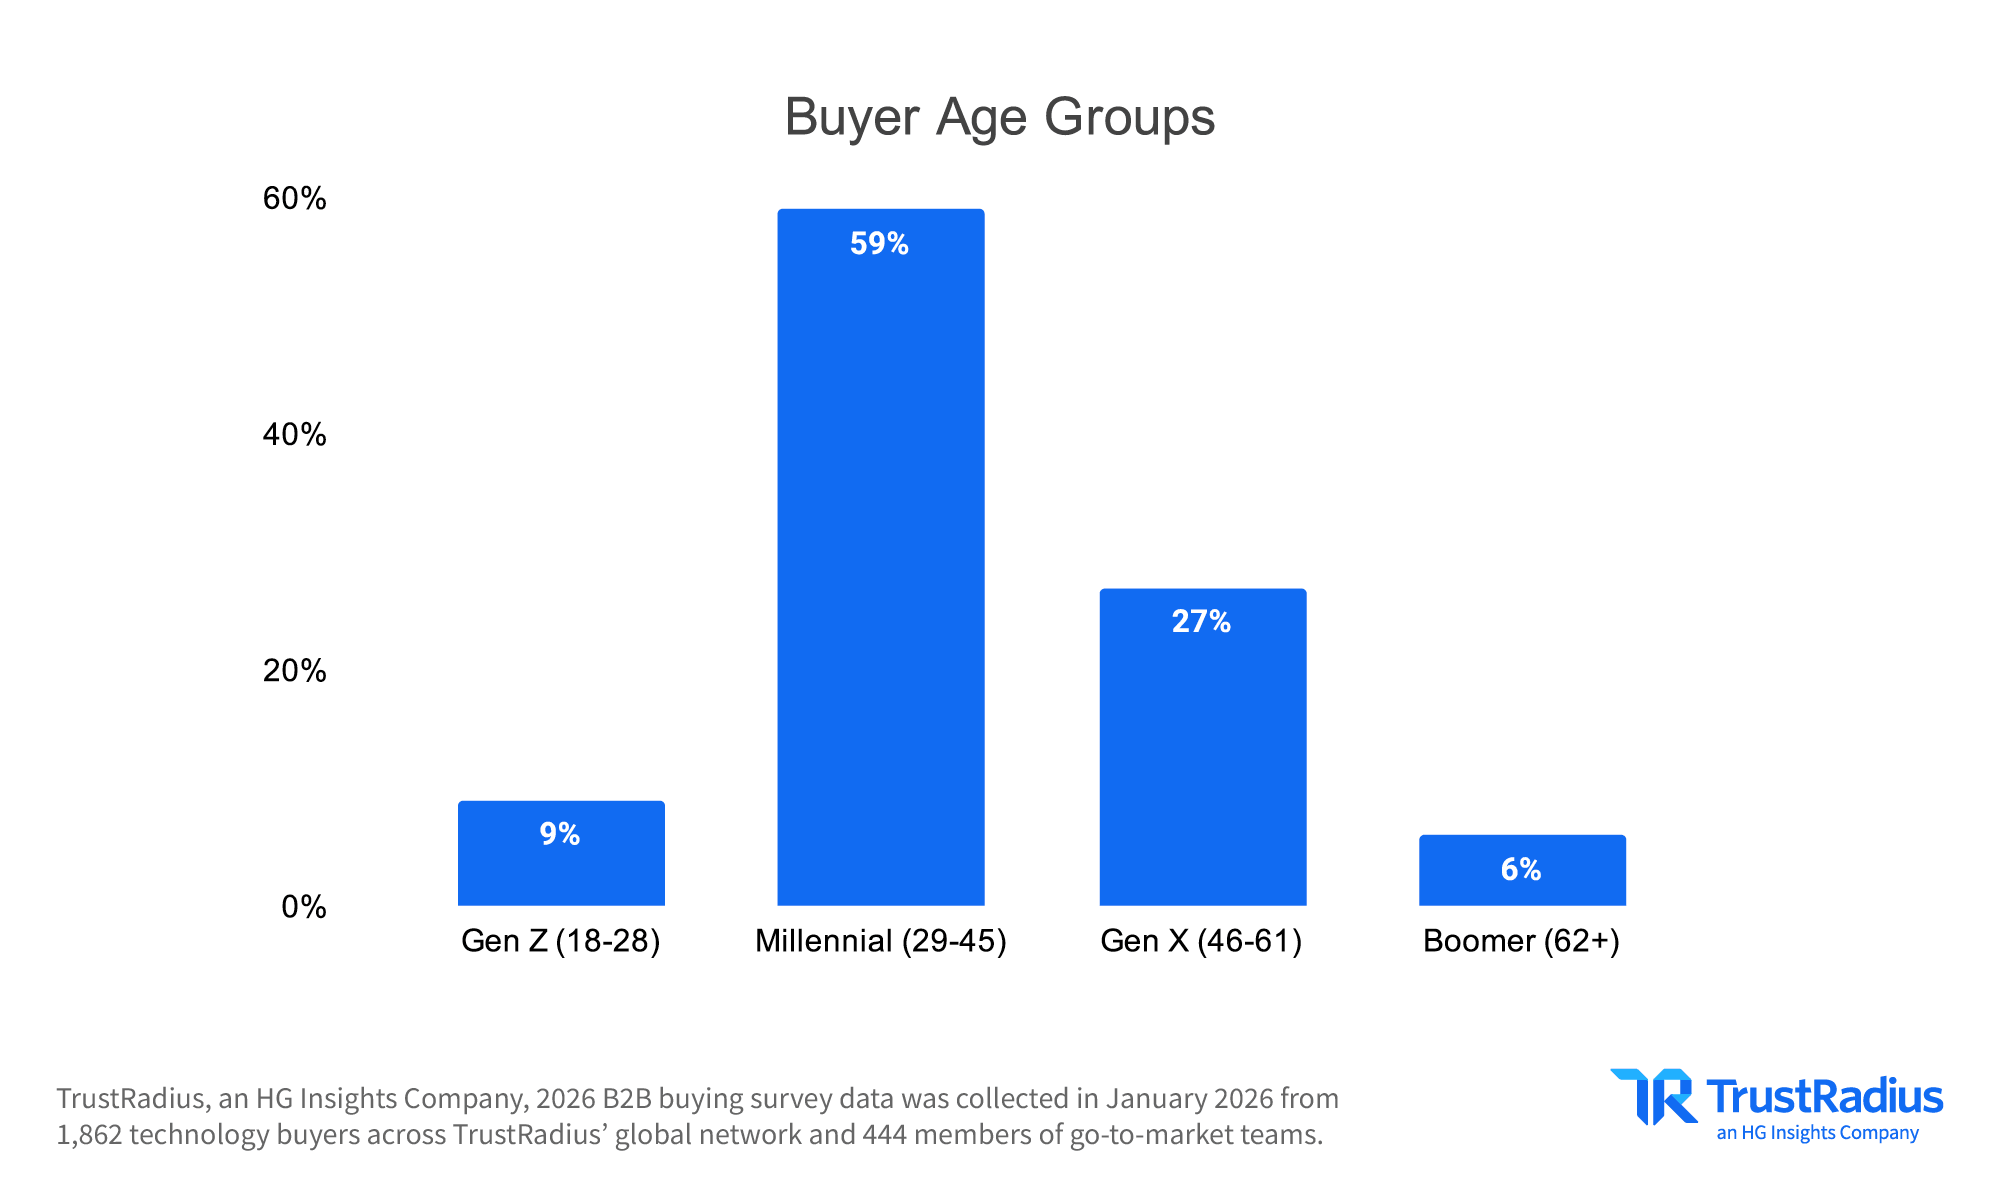
AI tools such as Large Language Models (LLMs) and AI search are the only resources that buyers consult more frequently than in previous years. Likewise, Millennial and Gen Z buyers (who make up the majority of our sample) are more likely to use these tools than older generations. When we asked buyers if they used AI at any point in their buying process, 63% said yes.
While AI usage is up, trust in AI tools is leveling off. We saw no major year-over-year changes in AI trust. Buyers are using these tools far more than before, but they don’t trust the outputs any more than they did last year. That’s another reason we don’t think AI will become a one-stop B2B SaaS shopping tool anytime soon.

VENDOR TIP:
Buyers are clicking on AI citations. Optimize your LLM presence by ensuring that your brand shows up for relevant buyer queries.
“Most people understand that while AI is amazing at pulling together vast amounts of information quickly, it does not yet have the ability to judge what is valid. With all of the tools we have been exploring, there is a step in the workflow where a human must approve prior to sending to a client or prospect.”
An area where we did see substantial changes was in the rate of AI fact-checking. More buyers said that they fact-checked AI outputs, with 72% of buyers checking very often or always, and 94% of buyers fact-checking at least some of the time.

In addition to the increases in the number of buyers who always or sometimes fact-check AI outputs, we saw substantial reductions in the percentage of buyers who rarely or never fact-check AI outputs. Since this increase in fact-checking is paired with an increase in usage, we believe that people are becoming more familiar with the limitations of these tools and are not relying on them as the sole source of information for their research process.
When fact-checking, the top 3 resources used were search engines (hello, Google), clicking through to AI citations, and other trusted sources.

The proliferation of AI-generated content could also account for this increase in fact-checking. 47% of buyers say that they trust online resources slightly or much less than they used to, and only 11% say that they trust these resources slightly or much more. Most telling, the share of buyers who trust online resources the same as they used to dropped 8 points in a single year, from 50% to 42%, meaning neutral buyers are actively shifting toward skepticism. AI seems to have created a trust crisis forming in real time: widespread adoption and growing skepticism at the same time.

Despite the increased wariness of online resources, overall, most buyers said that AI has made it easier for them to find the information they need. As compared to 2025, more buyers said AI made their research process better, and fewer said it had no impact. This was the biggest shift we saw year over year. Only 13% of buyers said that AI added extra work to their buying process, just 2% higher than last year.

AI Purchases Rule the Market
65% of our respondents said that their companies were prioritizing AI investments in 2026. At the enterprise level (1,001+ employees), that number jumps to 76%.
Of the buyers who responded to our survey, 59% purchased AI tools or tools with AI features. Among buyers whose purchase exceeded $100K, that number rose to 69%.
Why AI?
We asked buyers why their companies chose to invest in AI, and here are the reasons they gave for this investment:
- Drive greater efficiency (70%)
- Delivering faster time to value (51%)
- Avoid falling behind the competition (36%)
- Executive-led AI initiatives (35%)
- N/A: The product’s AI features weren’t relevant to our purchase decision (13%)
- Other – 2%
Executive-led AI initiatives were more common in larger companies and when the tool purchased came with a higher price tag.
Are the Tools Worth the Hype?
So far, AI tools and features are living up to the hype and the promises made during the sales cycle. The majority of buyers in our survey said that the AI product they purchased met their expectations.

It’s worth noting that we collected this data in early 2026, and asked buyers about a purchase they made in 2025. The vast majority of our respondents were a few months into using their new AI products, and weren’t at the point of making a renewal decision yet. It’s easy to feel like a tool is working well when it’s paid for, and the next payment is months away.
Individual contributors were generally the happiest with the AI tool purchased, with 81% saying the tool lived up to expectations. Higher titles didn’t always feel the same. For example, 59% of VPs said the tool lived up to expectations. We think there are a few potential reasons for this disconnect between ICs and execs. It’s possible that ICs (who likely completed a trial of the product if it was offered) may have more realistic expectations of the tool and its capabilities. Plus, it’s fun to use the latest and greatest, new, shiny tools.
VPs on the other hand expect the massive efficiency gains these tools promise and will question their investments if they don’t see them. Since VPs are far more likely to hold the budget, vendors still need to provide a clear ROI or risk being on the chopping block at renewal time.
“We are building AI skills workflows to provide ‘horizontal’ leverage on key workflows and working to create AI-accessible knowledge bases to create ‘vertical’ leverage around specific domains. We believe the layering together of workflows and knowledge will be a force multiplier.”
Measuring Success with AI
Providing clear ROI is vital for any software purchase, and AI is no exception. AI tools are new enough that ROI can feel fuzzier and harder to define. So how are buyers measuring success with AI?

According to buyers, time savings is currently the #1 success metric for AI tools, followed by a desire to produce higher quality outputs and go to market faster. While we’ve all seen the doom and gloom headlines around AI-based layoffs in the tech industry, only 20% of buyers said that they thought this was a goal of their company’s AI initiative.
When we asked vendors how they thought their customers would measure success with their tools, the answers were fairly similar. The order of the top 4 success metrics was the same, but vendors significantly underestimated how many buyers were using time savings and higher quality outputs as success metrics, and overestimated how many were using reduced headcount.

A striking disconnect is that 16% of buyers said they aren’t tracking their success with AI, while vendors estimated that number at just 3%. This is likely due to how new these tools are and the lack of clear, established metrics to evaluate them.
We know from the data above that most buyers think that the AI tools they’ve purchased are living up to expectations. Still, this feeling may not be sufficient to secure a renewal, particularly at a higher purchase price.
Interestingly, this trend was consistent across job levels, meaning that individual contributors were just as likely as executives (who often hold the budgets to buy these tools) to say they weren’t calculating the ROI of their AI investments.
“The biggest challenge with AI isn’t buying it—it’s proving value after it’s deployed. The customers seeing the most success are the ones that tie AI to measurable business outcomes like reducing handle time, increasing self-service, improving quality coverage, or lowering operational costs.”
This should be a red flag for AI vendors. Up to 16% of the time, these renewals are based on how the budget holder feels things are going without meaningful metrics to back them up. These vibes-based renewals present a real revenue risk to the companies relying on them, as they may not realize the relationship is in jeopardy until they receive a churn notice.
VENDOR TIP:
Don’t rely on feelings alone. Ask your customers how they’re measuring their success with your tool, and be prepared to provide clear guidance if they’re not sure how to do so.
Crossing the Finish Line
Most buyers said it was either easy (33%) or somewhat easy (24%) to get their purchases approved, and only 15% said it was somewhat difficult or difficult to get a deal over the finish line.
Despite organizations prioritizing AI spending, AI tools were slightly harder to get approved than other tools. This may be due to security concerns/reviews and the fact that these tools were typically more expensive than non-AI tools. Even if these tools were ultimately purchased, the extra scrutiny likely made the process feel more difficult for those in the buying group.

Build that Brand!
For the past several years, we’ve emphasized the importance of brand awareness in the buying journey. After all, 79% of buyers had heard of the tool they purchased before they even started researching. This means that in most cases, if the buyer doesn’t know who you are before they start shopping, you’re not making the shortlist, much less closing the deal
The Short List is Still Short
83% of buyers shortlisted 3 or fewer products, living up to “short” in shortlisting. The average number of products on a shortlist was 2.7 overall, and 3.2 for high purchase prices. 67% of buyers ultimately purchased the product that was their first choice at the time that they made their shortlist.
Further, 66% of buyers said they purchased an established, leading product, and 21% said they purchased a niche product targeted at a particular segment. This means that 87% of buyers purchased either a market leader or industry-specific solution, leaving only 13% of the pie for smaller or disruptor brands.
Why Buyers Buy
The number one reason that buyers selected a particular software product was that it met their needs for the best price. This answer makes sense to us. If a buyer has 3 products on the shortlist that they are equally confident in, but one costs less, it’s likely that the buyer will choose the most economical option.

Notably, we saw a few year over year changes. Price dropped slightly in importance, at the same time that picking the safest option saw a small increase. While it’s still low on the list, “their demo blew us away” increased substantially this year. We believe that all three of these changes can be explained by changing AI investments.
Price is likely less of a concern for companies investing in new AI tools for the first time. These companies may be willing to pay a higher price in order to unlock the results they expect from these investments.
For some portion of vendors, these new AI tools are likely driving a good bit of uncertainty. When buyers aren’t equally confident across their shortlist, they are most likely to turn to what they perceive as the safest, most trusted option. Gen Z buyers were notably more likely to select this way, likely reflecting career-stage risk aversion; recommending an unfamiliar tool carries reputational risk when you’re still establishing credibility.
Many AI tools are new to the market. This means buyers are less likely to have their own experience with a tool, or have a peer in their network they can talk to about the product. This is where demos come in. A demo allows buyers to see a new product in action, and can help them to feel confident in your product.
VENDOR TIP:
If you’re selling a new product, invest in your demo process. When other sources of feedback are limited, a quality demo can give a buyer the confidence they need to move forward with a purchase.
What Vendors Don’t See
As we noted earlier, buyers are using the same number of resources, but there’s more variance than we’ve seen in previous years. Vendors are using fewer tactics overall, though the top 5 tactics used remain unchanged from last year.

While the company website and demos are important resources for buyers, vendors are still investing substantial efforts into resources that buyers value the least. In fact, vendors said that their sales representatives were the most influential resource they have when it comes to closing deals.

Buyers, on the other hand, have expressed a preference for product demos, free trials, and finding information on the company’s website over sales engagement. This doesn’t mean vendors shouldn’t invest in their sales teams. A bad experience with an unprepared salesperson won’t do you any favors in the revenue department, but vendors should understand that by the time a buyer is engaging with their sales team, they likely already have a shortlist and a preference.
“Trials, demos, and pricing are the top criteria. If the rep is difficult, we’d pass on the product but we would not select a product based solely on the rep. But a rep who expedites the process will always win the deal. We typically consider delays in the sales process a predictor of sloppy service and product support. For our own product, if something can be built into the product, we’d prefer to do that versus offering it through a human touch—be it sales or support.”
Third-Party Validation is Driving Your Brand Narrative
Buyers prefer resources that give them first-hand knowledge of the product, but those aren’t always available or sufficient. After all, even the best demos don’t always dive into use-case or niche-specific features.
This is where third-party validation comes into play. Your customers are sharing feedback about your product, whether you realize it or not.
The Power of Peer Conversations
53% of buyers said they spoke to a peer who used the product they were evaluating prior to making the purchase. This number only increases with purchase price, as 65% of high purchase price buyers had peer conversations. Meanwhile, vendors estimate that only 41% of their prospects spoke to a current customer.
In addition to underestimating how frequently these conversations occur, vendors also underestimate their impact. 83% of vendors thought that these conversations were at least somewhat helpful vs. 100% of buyers. Let that sink in. Every single buyer who had a peer conversation said it was at least somewhat helpful in making their purchase decision. In most cases these conversations built confidence in the product, confirmed it would perform for the buyer’s unique use case, and validated what buyers saw/heard at other points in their buying journey.

User Reviews Fill in the Gaps
74% of buyers said they consulted user reviews as part of their buying process, and most of them used a software review site to find those reviews. The shift toward third-party review sites and away from vendor-hosted reviews reinforces the broader trust trend in this report; buyers are increasingly seeking validation from sources vendors don’t control. In addition to review sites, buyers are looking for reviews in other places, including on the vendor’s website and search engine result pages (SERPs).

Notably, all three 3rd-party sources of reviews saw a year over year increase. Reviews on a vendor’s site is the only type of review that decreased from 2025. This is evidence of a trend we’ve seen for years: buyers consult vendor-produced resources as a part of their buying process, but they don’t make a purchase decision until they’ve validated vendor claims with a 3rd party source.
“Peer conversations have been a huge part of our growth over the last 3 years. When someone or a company has an amazing experience, they will share with their peers unsolicited. As a disruptive technology, Hoxhunt counts on our differentiation in the outcomes we provide, when we do that, people share. Results don’t lie.
In a world where anyone with a Claude license can create an app, it’s hard to know what works and what is vaporware, the best way to find out is finding a successful, trusted peer to validate. The stakes have never been higher when purchasing new products, and prospects want market validation so they can at least say they did their due diligence.”
VENDOR TIP:
Your buyers want to hear from your current customers. Ensure you have reviews and customer testimonials available across channels, including on review sites, your website and YouTube.
Beyond just reviews, buyers turn to review sites for other self-serve information like demos, and feature-specific scores.

Notably, the content of the reviews themselves and how relatable the reviewers were two of the most important factors for buyers using review sites. The theme here is clear: buyers seek out user testimonials (either through a review or peer conversation) to confirm that the tool will work for their unique use case.
“TrustRadius’ latest findings highlight a clear disconnect: buyers rely heavily on peer validation, yet vendors consistently underestimate how often it happens. In our work with peer review programs, we see that buyers aren’t just looking for validation— they’re looking for confidence from people who’ve been in their shoes. Reviews are how you scale those trusted conversations, making customer voice a true driver of business impact.”
Buyers Don’t View All Third-Party Validation Equally
Not every form of third-party validation is effective in persuading buyers that your product is right for them. Real user perspectives are far more persuasive to buyers than other options. In this vein, we’ve seen that analyst reports continue to decrease in usage year over year. This year, only 13% of buyers said they consulted an analyst report, a 63% decrease since 2022.

GEO, the new SEO
Some buyers are bypassing traditional search entirely. Unlike traditional SEO, Generative Engine Optimization (GEO), sometimes called Answer Engine Optimization (AEO), can be harder to track. Fewer buyers report visiting Google than in previous years,while LLMs and AI search engines continue to climb. Showing up in these AI-generated results is critical for brand awareness and visibility.

From our survey, we can tell that vendors understand the potential of these AI tools for brand visibility. Most vendors think that AI tools have had a somewhat or very positive impact on their brand’s discoverability. This makes sense, given that most vendors think that AI is leveraging their site content as source material.

Vendors also seem to be aware of the influence of third-party sources, such as review sites, social media, and independent media, on LLMs and AI search.
VENDOR TIP:
LLMs and buyers alike value third-party validation. Ensure that you’re aware of and influencing how the market perceives your product.
Building a Successful GTM Motion in the Fragmented Market
Buyers are using the same number of resources as we’ve seen in previous years, but there’s more variance in the resources they’re consulting. Different buyers use (and trust) different resources. This makes for a fragmented market with significant challenges for vendors. How do they know what resources their buyers value or where to place their marketing effort? How do they even know who their potential buyers are?
GTM Challenges
Despite this fragmentation, vendors overall felt better this year about their GTM strategies. While the percentage of vendors who gave themselves an “A” stayed consistent, we saw more Bs, and fewer Cs and Fs than last year.

To us, this means that vendors feel they are adapting and improving their GTM motions, but still have some work to do. The challenges vendors are facing have changed slightly since last year as well.

Sales and marketing effectiveness is still in the top spot, with more vendors than ever indicating this is a challenge. The competitive landscape and finding and reaching in-market buyers have switched places. Product market fit and compelling positioning and messaging are now tied.
The Right GTM Data Makes All the Difference
Notably, fewer vendors struggled to find and reach in-market buyers this year. We think this is likely because most vendors are investing in GTM data to help ensure they’re putting their marketing efforts in the right place.

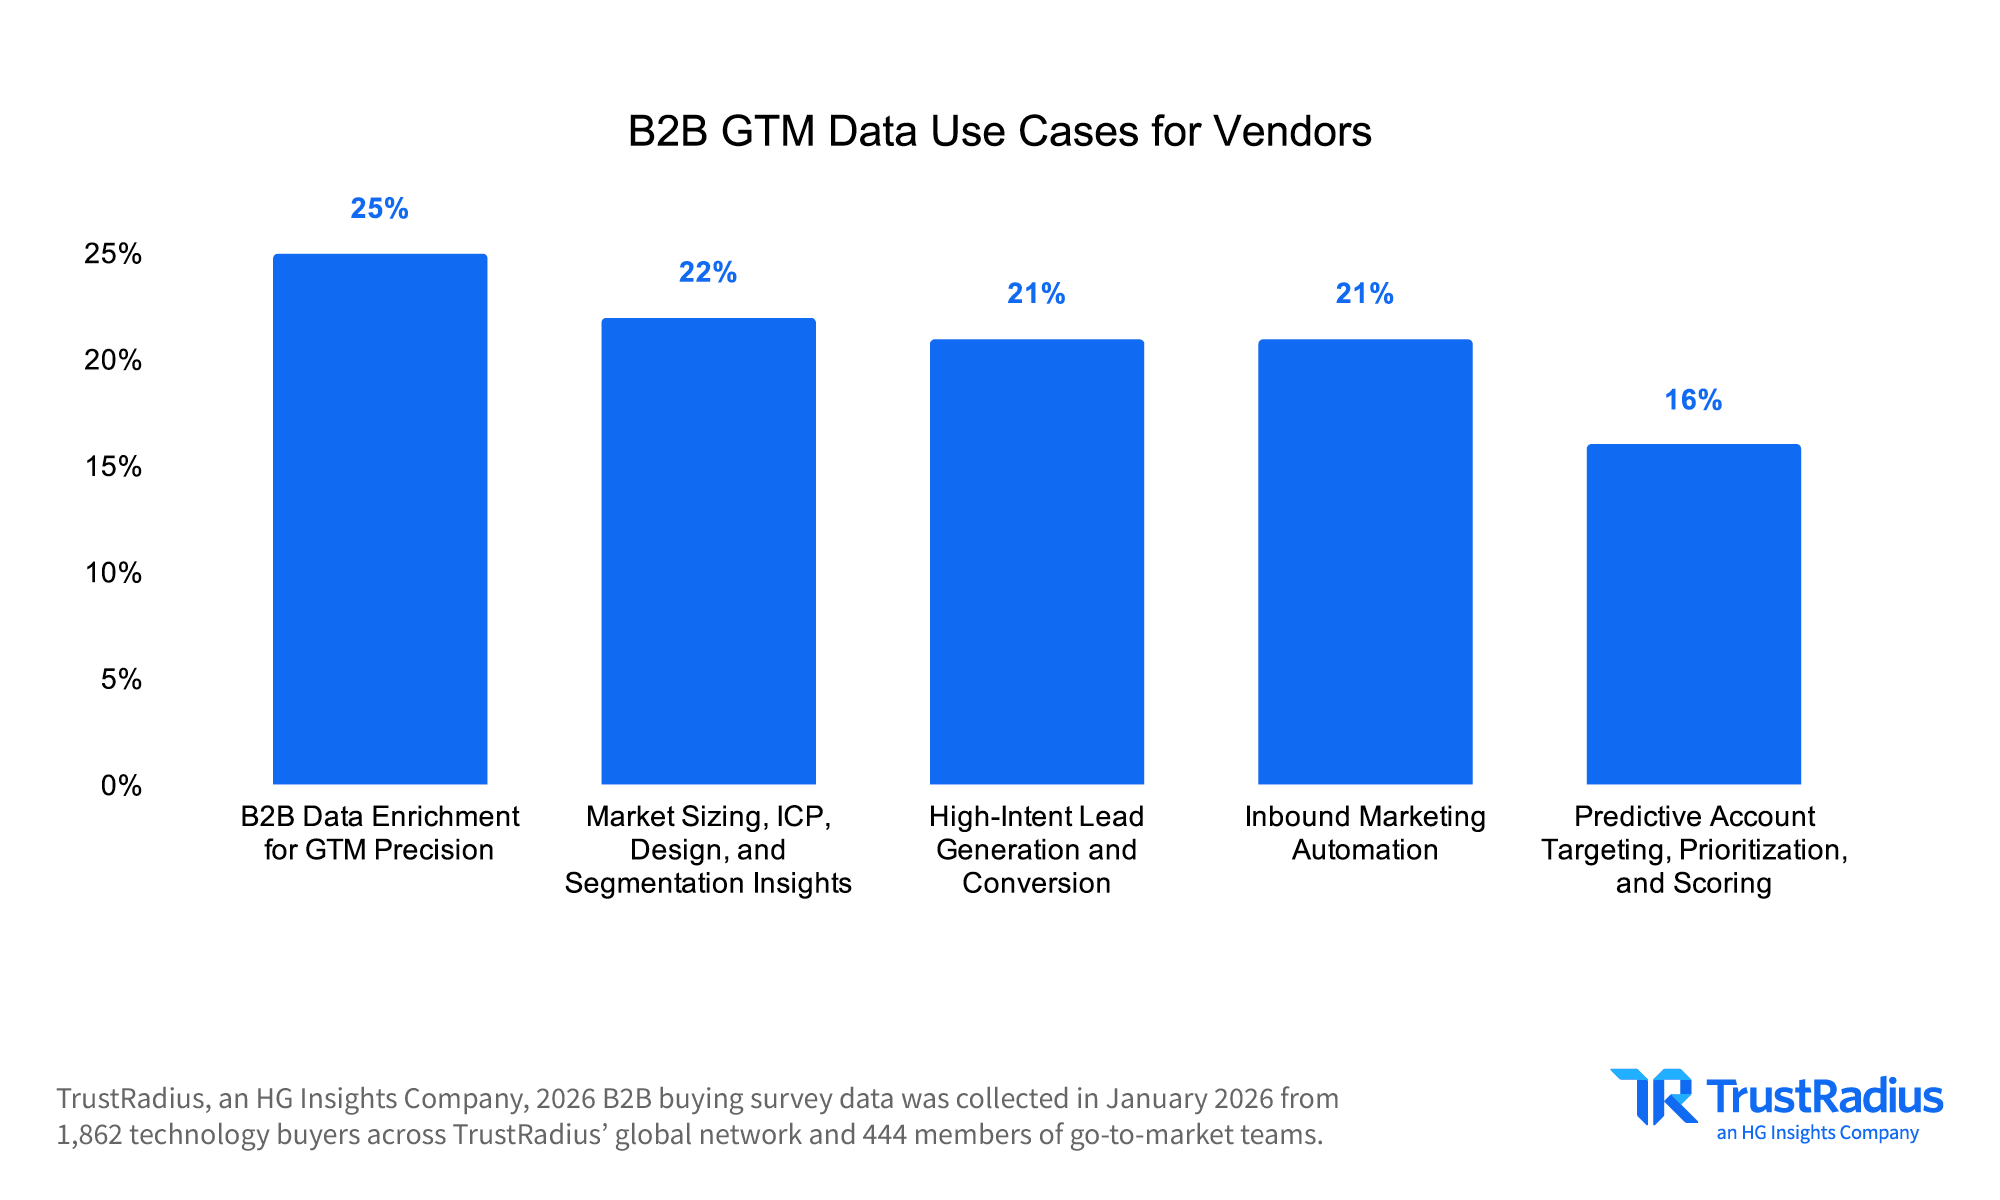
B2B Data Enrichment for GTM Precision is both the most common and most influential use case for GTM data. Interestingly, while competitive analysis and displacement made it into the top 5 most common use cases, it failed to make the top 5 when it came to importance (it tied for 6th).
Beyond usage, most vendors have a clear idea of how to measure success with their GTM data. Data accuracy was the most common success metric, which makes perfect sense. If your GTM data is inaccurate, everything else goes out the window.
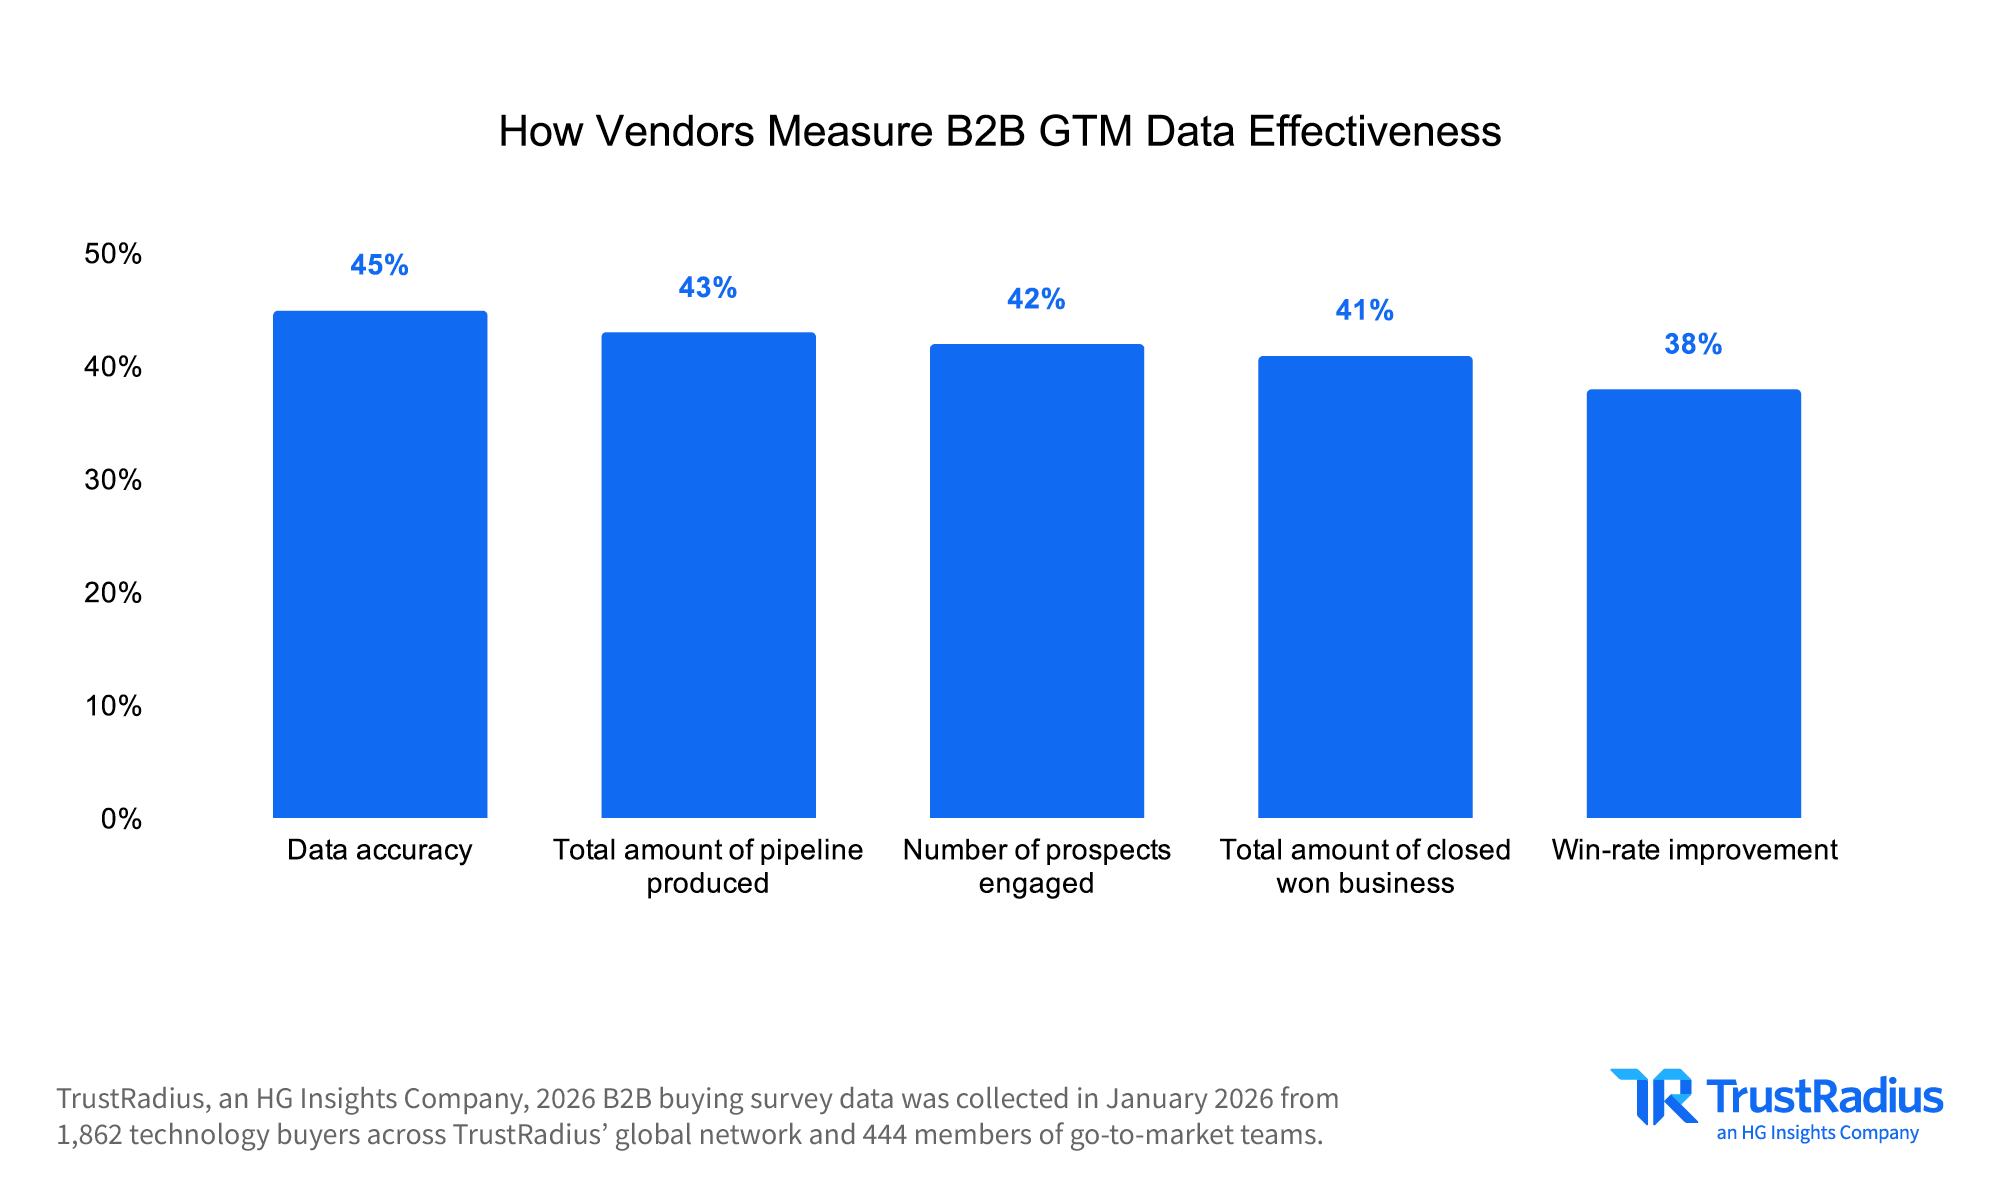
When we look at the most important metrics, data accuracy drops to the #2 spot, behind total amount of closed won business. Again, this makes sense to us, as this is the clearest measure of ROI. After all, it doesn’t matter if you’re reaching the right audience if you’re not closing deals.

The Disconnect
Most vendors think they’re doing OK with their GTM motions. They feel confident they’re reaching in-market buyers, and that the shift from traditional search to AI has not had a negative impact on their brand visibility. That said, our buyer data indicates that vendors continue to miss the mark in a few areas. We asked buyers what they wish they could change about the buying process. As with the resources consulted, we saw more variance across the answers than we did last year.

“When pricing is hidden, I assume it’s expensive, or it’s negotiable in ways that don’t favor me. Both make me less likely to engage, not more. “Contact sales” is a tax on my time, and plenty of vendors have lost my shortlist spot before we ever talked because there’s always another vendor you can just sign up with and move on with your business.”
Unsurprisingly, transparent pricing was the #1 answer. This probably sounds familiar if you’ve read any of our past research. Nobody wants to find out that they’ve been researching a $50k product when they have a $10k budget. Transparent pricing helps buyers ensure that they’re focusing their search on products they can actually purchase. In addition to being the most common thing buyers wish they could change, transparent pricing is also the most important.

Our top two did not change much from last year, but understanding evaluation criteria/requirements moved up from 4th to tie for 3rd place. Transparent pricing is down slightly year over year, which makes sense to us. Fewer buyers said they made their purchase decision because the product met their needs for the best price too. Once again, this is likely due to increasing AI investments. Transparent pricing and getting the best price is less important for a new tool where the “best price” hasn’t been established, and companies are still figuring out the value and expected ROI of these tools.
VENDOR TIP:
Drive buyer trust by helping them find the resources they’re looking for. Ballpark pricing, demos, free trials, and customer references help to build confidence.
Looking Forward: How Software Buying Will (and Won’t) Evolve
A major “unknown” that could entirely derail our predictions around AI investments and growth is the role of government regulation. Assuming no regulation that totally upends the industry is passed, we think that AI is the buzzword that will continue to buzz for the foreseeable future. Companies are unlikely to abandon their AI investments entirely, though they may switch tools if they feel the ones they initially selected aren’t providing sufficient ROI.
We saw an increase in AI usage for the third year in a row, but AI trust leveled off. Buyers are becoming more AI savvy; they’re learning how to use it effectively and what its limitations are. This means that they’ll continue to learn how to use these tools to make their software buying process more efficient. Likewise, they’ll get better at evaluating the AI tools or features that they’re purchasing. Simply having an AI feature or beta program won’t be enough. These features will need to be well integrated into the product, and drive measurable results.
VENDOR TIP:
Your AI features will need to be additive to your product experience, and demonstrate real results.
Additionally, we think we’ll continue to see increased variance in the resources buyers use to make a decision. Resources that give buyers first and second-hand experience with the product will continue to be at the top of the list, but buyers will vary on what they use to supplement them.
These preferences may be influenced by a buyer’s preferred LLM and a vendor’s GEO strategy. If you spend any time on LinkedIn, you’ll see “influencers” with strong LLM preferences. ChatGPT, Claude, Gemini, etc., have all been trained differently, and each one has its loyalists. Likewise, it is possible that buyers may start to prefer the types of content that their preferred model regularly surfaces. For vendors, this means you need to have an understanding of how your product is portrayed by each model, and lean into developing the content that is frequently cited by each one.
Methodology
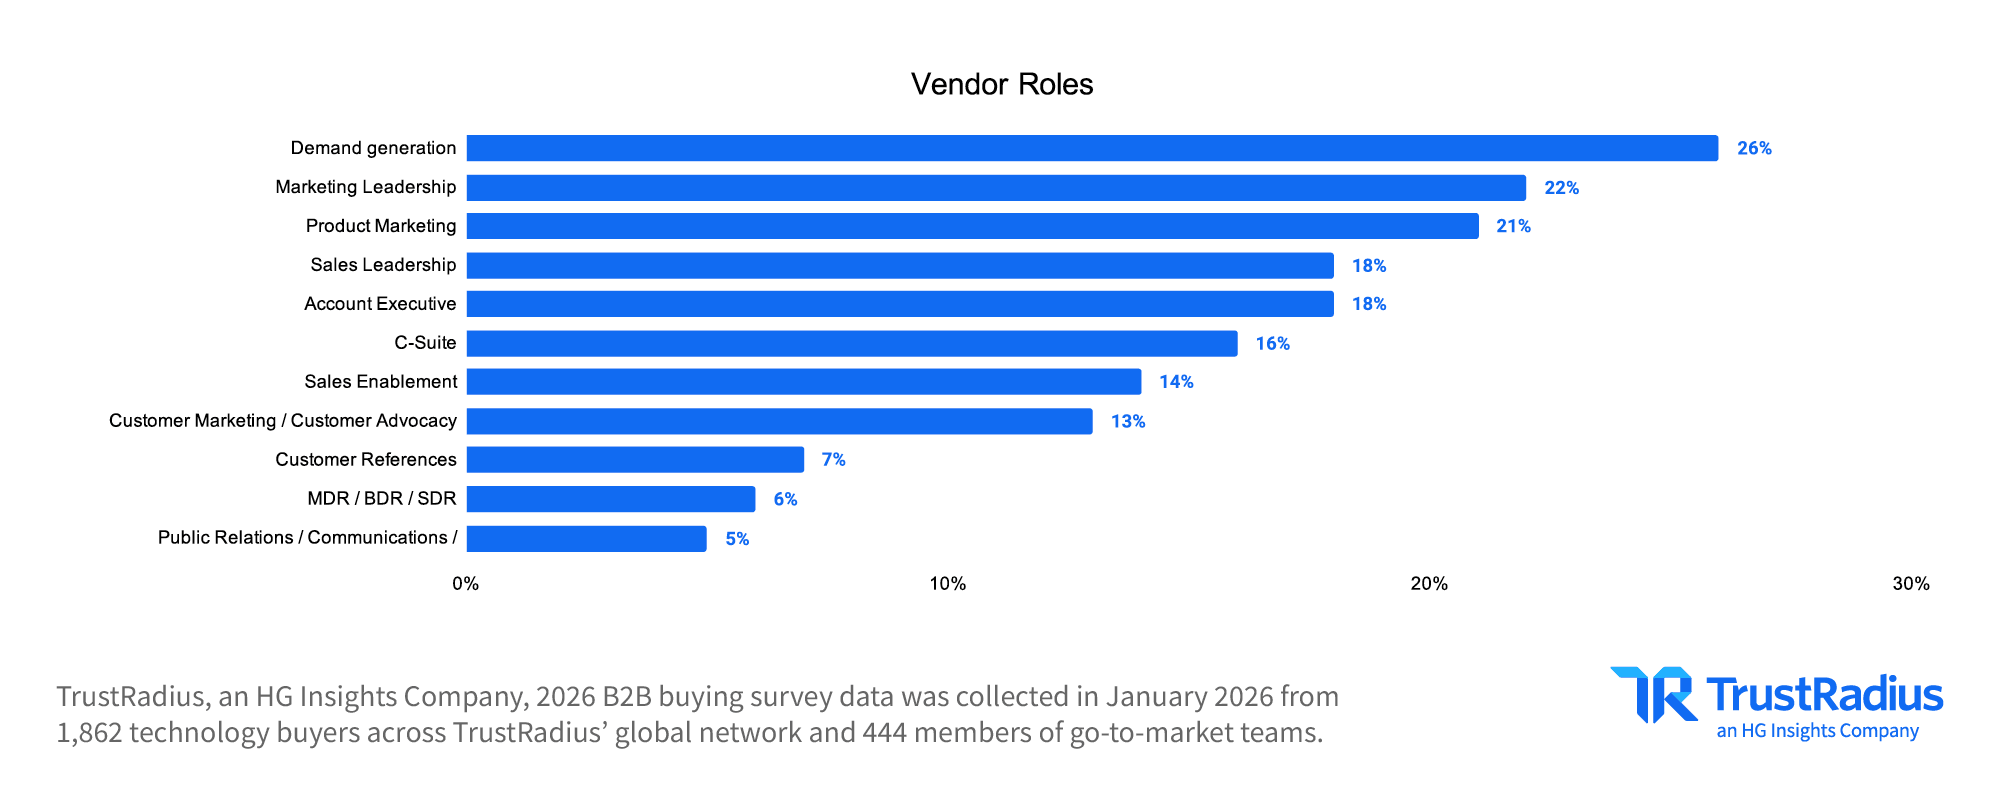
Data for the TrustRadius 2026 B2B Buying Disconnect Report was sourced from the TrustRadius global network via an online survey. In January 2026, we sent online surveys to professionals who were involved in a software or hardware purchase for their organization in the past year. We sent a separate survey to members of go-to-market teams for technology vendors.
We received complete, verified responses from 1,862 technology buyers and 444 technology vendors. All respondents were offered a nominal incentive ($10 gift card) as a thank-you for their time. We’ve included information below on the demographics of our survey respondents. For a full list of survey questions and answer choices, or if you have any questions about the data, email us at research@trustradius.com.
Demographics

Top 10 Takeaways
- 94% of buyers who used AI fact checked it at least some of the time.
- AI usage has increased, but trust levels remain consistent with last year.
- 74% of buyers use reviews to inform their purchase decisions.
- AI tools, or tools with AI features made up 59% of the purchases our buyers made in the past year.
- 75% of buyers who purchased an AI tool say that it has lived up to their expectations.
- 83% of buyers shortlisted 3 or fewer products.
- Analyst reports were only used by 13% of buyers to make their purchase decisions, a 63% decrease since 2022
- Data accuracy is the most common success metric for GTM data, but the total amount of closed-won business is the most important to vendors.
- Transparent pricing has been the #1 item on buyers’ wish list for vendors for 4 years running (since we started asking in 2023).
- 79% of buyers had heard of the tool they purchased before they even started researching.