Introducing Metrics – Advanced Reporting Dashboards for TrustRadius Customers
Are you looking to gather deeper insights into your product’s performance on TrustRadius? Look no further. We are thrilled to announce the launch of Metrics—self-service dashboards with advanced filtering, attractive data visualizations, and easily exportable datasets. Analyze the data you need to improve program performance and meet your business goals.
What’s available in Metrics?
We have two new dashboards available, and more on the way. Today, you can find:
- Single-product dashboard — This dashboard is an overview of important metrics per subscribed product like page views and review count over time.
- Multi-product dashboard — This dashboard is an overview of important metrics across all of your products, if you have more than one product subscribed with TrustRadius.
Which data points and visualizations can I expect?
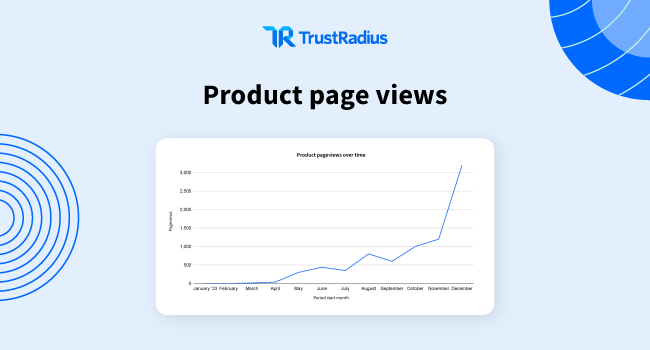
Product page views over time
Get an idea of page-view growth from in-market buyers researching your product listing. Filter by your preferred date range to see a snapshot in time. Better account for considerations like seasonality, traffic spikes, and year-over-year performance. If you have multiple products under subscription, you can see page-view growth for all of your subscribed products in one easy-to-export visual.
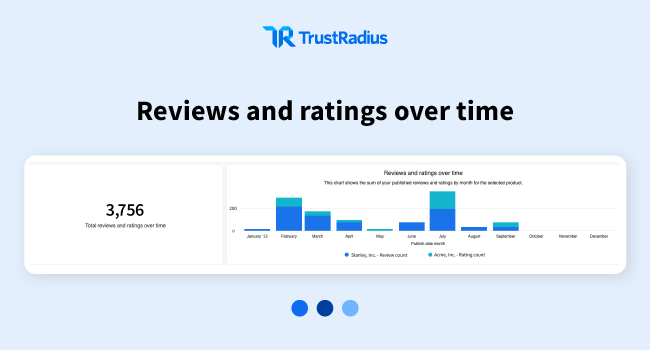
Reviews and ratings over time
Get an at-a-glance performance of total reviews and ratings over time, as well as a stack rank of reviews and ratings growth by month. If you have multiple products under subscription, stack rank review growth across products in one streamlined view, which is great for portfolio customers. Easily schedule reports to your inbox and keep a steady pulse of reviews and ratings coming in each week, month, quarter, etc.
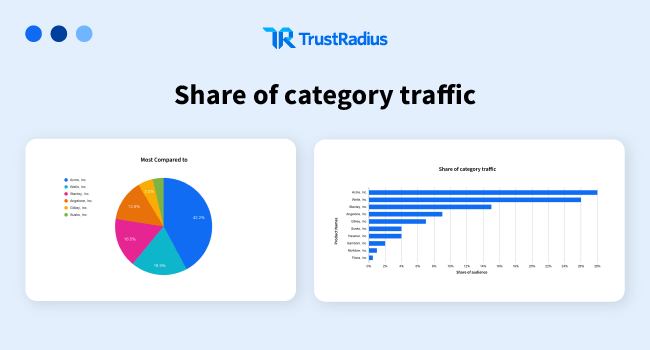
Share of category traffic
Want more competitive insights? Get a better understanding of how you measure up against in-market competitors also listed on TrustRadius. See who buyers are most often comparing you to, which of your competitors are emerging or receding in your category, and how you measure up at-a-glance in terms of category domination.
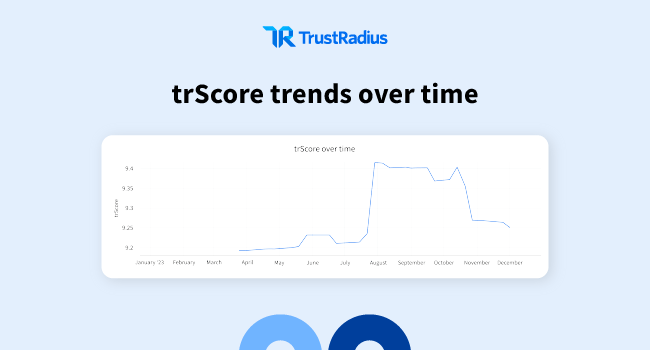
trScore over time
Curious how your trScore has increased or decreased over time? Get a better understanding of your trScore data with a side-by-side view of review growth over time. trScore is an algorithm that evaluates a product’s scores based on a weighted average of reviews and ratings, instead of a simple average. It’s an insightful metric to understand product satisfaction with your customers over time.
How does Metrics differ from insights previously available within the Vendor Portal?
Performance at-a-glance — All of your key performance data points are now available in one dashboard. Quickly filter by one or multiple products to see where you need to take action next. We’ve improved overall capabilities to include all of the new bells and whistles listed below.
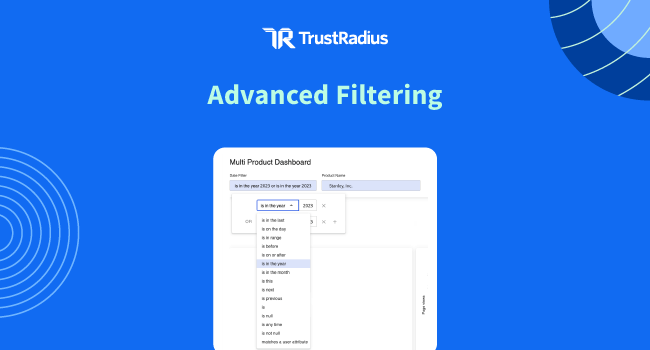
Advanced filtering — Easily filter by a variety of pre-populated date range criteria or select a custom range.
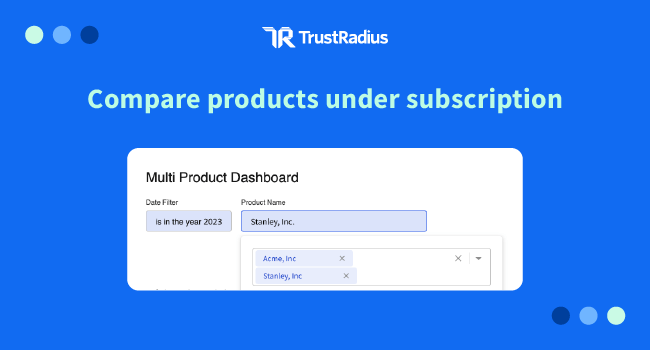
Compare products under subscription — Get one view of all your products’ performance in one easily digestible format. Report on your entire portfolio’s performance without having to go into each product’s individual reports.

Automate delivery — Schedule reports at your preferred cadence to be delivered via email to you and to key stakeholders on your team.

CSV/Excel exports — Quickly download datasets for your own analysis and streamlined sharing with teams.

Download images for presentations — With a click of a button, download any visual to a PNG (or other format) to drop into your leadership presentations and more.
Ready to get started?
Metrics are included in all customer packages. As a TrustRadius admin, access the Metrics dashboards by logging into your vendor portal and click on Metrics in the side navigation.
What’s next for Metrics?
We are working on additional Metrics dashboards to be rolled out later in 2023-2024. You can expect similar data but more views, advanced filtering, deeper insights, and a lot more!


